


Bob Ritchie
-
Posts
121 -
Joined
-
Last visited
-
Days Won
1
Content Type
Profiles
Toronto Blue Jays Videos
2026 Toronto Blue Jays Top Prospects Ranking
Toronto Blue Jays Free Agent & Trade Rumors, Notes, & Tidbits
Guides & Resources
2025 Toronto Blue Jays Draft Pick Tracker
News
2026 Toronto Blue Jays Draft Tracker: Picks & Bonuses
Forums
Blogs
Events
Store
Downloads
Gallery
Everything posted by Bob Ritchie
-
Andrés Giménez is known for his elite defence. Since Giménez became an everyday player in 2022, Dansby Swanson is the only infielder to post higher OAA and FRV marks. On the basepaths, of 258 qualified players from 2022-2025, Giménez ranks 25th according to FanGraphs BsR. Another area where Giménez ranks among MLB’s best is getting hit by pitches. Consider Table 1. Starting in 2022, Giménez has been hit by a pitch 68 times, second only to Ty France. Looking at PA/HBP, his 29.46 score (as of June 21) ranks fifth lowest. In other words, only four qualified batters have averaged fewer plate appearances before getting hit by a pitch than Giménez. Against right-handed pitchers, he slots in at number five with his 47 HBP (17th in PA/HBP). When facing left-handers, Giménez has absorbed 21 HBPs, MLB’s highest mark and good for the eighth-lowest PA/HBP (26.43). Whether a righty or a lefty is on the mound, Giménez’s motto has been, Hit Me with Your Best Shot. An interesting nugget is the difference between Giménez's HBP scores in counts with fewer than two strikes and with two strikes. Consider Table 2. With fewer than two strikes against him, Giménez has 22 HBPs, which slots in as MLB’s 22nd-highest number since 2022. However, with two strikes, no player has more HBPs than Giménez. For context, I calculated Giménez’s on-base percentage if those 46 HBPs with two strikes were strikeouts. For the 2022-2025 period, his official OBP was .321. If the 46 HBPs were strikeouts instead, his OBP would be .298. That is a notable OBP reduction. Note that I did not calculate PA/HBP for all hitters within the two strikes/fewer than two strikes split because it was too cumbersome to incorporate FanGraphs' (HBP) and Baseball Savant’s (strike counts) data. For those interested, here is a link to MLB’s all-time leaders in the hit-by-pitch category. So, why does Giménez rank so high in the HBP metric? No, I do not believe pitchers dislike Giménez. Perhaps the answer lies in his batting stance. Welcome to a new feature from Baseball Savant! A user can select a player of their choice and the desired period (from 2023 onwards). Below is a screenshot of Giménez’s batting stance for the 2023-2025 period. I encourage the reader to take advantage of Baseball Savant’s Batting Stance tool. One intriguing element is that users can see how a player’s feet move from his batting stance to the pitch release and then to the bat-ball intercept. Let’s see if the batting stance data explains why pitches hit Giménez at a high rate. Behold Table 3. I selected a small sample of left-handed batters to determine if the batting stance data offered clues regarding why Giménez excels at getting hit by pitches. Unfortunately, there is no apparent explanation. Giménez and Bryce Harper have similar depth in the box, and off plate and between feet distances, but quite different stance angles and PA/HBP records. Except for the distance between their feet, Josh Naylor’s characteristics are like Giménez’s stance details. Furthermore, I performed regression analysis for the 2023-2025 period and found limited correlation between PA/HBP data and the listed stance datapoints. The lack of a meaningful correlation could be due to a small sample size. Perhaps there is no meaningful relationship between getting hit by a pitch and batting stance characteristics. Hmm. Perhaps video can help explain the attraction between Giménez's body parts and pitched baseballs. This first clip is from the June 19, 2025, game against Arizona. The pitcher was right-handed, and there were two strikes: In the case below, the pitcher was a left-hander: The final clip captures one of the times Giménez was hit when he played for Cleveland: These three clips show that Giménez does not shy away from inside pitches; he stands his ground and apparently is unafraid to get hit. Other than Giménez’s willingness to be hit, particularly with two strikes, I can offer no other evidence-based reasons why Giménez has been one of the leaders in the hit-by-pitch department. Perhaps it is a gift, just like it was for a famous ballplayer from the past. The Last Word Giménez is an elite defender and an excellent baserunner. Another noteworthy aspect of his play is that he has a top-tier record when it comes to HBPs. He is particularly “hittable” when the count reaches two strikes. Concerning why pitches hit Giménez at a high rate, there are probably multiple contributing factors. One is an apparent willingness to stand his ground and absorb a pitch. In summary, concerning Giménez’s attitude at the plate, Pat Benatar was prescient with her song, Hit Me with Your Best Shot! View full article
-
.jpg.618bb6f9c0d11a75a2615d002aa743a8.jpg) Andrés Giménez is known for his elite defence. Since Giménez became an everyday player in 2022, Dansby Swanson is the only infielder to post higher OAA and FRV marks. On the basepaths, of 258 qualified players from 2022-2025, Giménez ranks 25th according to FanGraphs BsR. Another area where Giménez ranks among MLB’s best is getting hit by pitches. Consider Table 1. Starting in 2022, Giménez has been hit by a pitch 68 times, second only to Ty France. Looking at PA/HBP, his 29.46 score (as of June 21) ranks fifth lowest. In other words, only four qualified batters have averaged fewer plate appearances before getting hit by a pitch than Giménez. Against right-handed pitchers, he slots in at number five with his 47 HBP (17th in PA/HBP). When facing left-handers, Giménez has absorbed 21 HBPs, MLB’s highest mark and good for the eighth-lowest PA/HBP (26.43). Whether a righty or a lefty is on the mound, Giménez’s motto has been, Hit Me with Your Best Shot. An interesting nugget is the difference between Giménez's HBP scores in counts with fewer than two strikes and with two strikes. Consider Table 2. With fewer than two strikes against him, Giménez has 22 HBPs, which slots in as MLB’s 22nd-highest number since 2022. However, with two strikes, no player has more HBPs than Giménez. For context, I calculated Giménez’s on-base percentage if those 46 HBPs with two strikes were strikeouts. For the 2022-2025 period, his official OBP was .321. If the 46 HBPs were strikeouts instead, his OBP would be .298. That is a notable OBP reduction. Note that I did not calculate PA/HBP for all hitters within the two strikes/fewer than two strikes split because it was too cumbersome to incorporate FanGraphs' (HBP) and Baseball Savant’s (strike counts) data. For those interested, here is a link to MLB’s all-time leaders in the hit-by-pitch category. So, why does Giménez rank so high in the HBP metric? No, I do not believe pitchers dislike Giménez. Perhaps the answer lies in his batting stance. Welcome to a new feature from Baseball Savant! A user can select a player of their choice and the desired period (from 2023 onwards). Below is a screenshot of Giménez’s batting stance for the 2023-2025 period. I encourage the reader to take advantage of Baseball Savant’s Batting Stance tool. One intriguing element is that users can see how a player’s feet move from his batting stance to the pitch release and then to the bat-ball intercept. Let’s see if the batting stance data explains why pitches hit Giménez at a high rate. Behold Table 3. I selected a small sample of left-handed batters to determine if the batting stance data offered clues regarding why Giménez excels at getting hit by pitches. Unfortunately, there is no apparent explanation. Giménez and Bryce Harper have similar depth in the box, and off plate and between feet distances, but quite different stance angles and PA/HBP records. Except for the distance between their feet, Josh Naylor’s characteristics are like Giménez’s stance details. Furthermore, I performed regression analysis for the 2023-2025 period and found limited correlation between PA/HBP data and the listed stance datapoints. The lack of a meaningful correlation could be due to a small sample size. Perhaps there is no meaningful relationship between getting hit by a pitch and batting stance characteristics. Hmm. Perhaps video can help explain the attraction between Giménez's body parts and pitched baseballs. This first clip is from the June 19, 2025, game against Arizona. The pitcher was right-handed, and there were two strikes: In the case below, the pitcher was a left-hander: The final clip captures one of the times Giménez was hit when he played for Cleveland: These three clips show that Giménez does not shy away from inside pitches; he stands his ground and apparently is unafraid to get hit. Other than Giménez’s willingness to be hit, particularly with two strikes, I can offer no other evidence-based reasons why Giménez has been one of the leaders in the hit-by-pitch department. Perhaps it is a gift, just like it was for a famous ballplayer from the past. The Last Word Giménez is an elite defender and an excellent baserunner. Another noteworthy aspect of his play is that he has a top-tier record when it comes to HBPs. He is particularly “hittable” when the count reaches two strikes. Concerning why pitches hit Giménez at a high rate, there are probably multiple contributing factors. One is an apparent willingness to stand his ground and absorb a pitch. In summary, concerning Giménez’s attitude at the plate, Pat Benatar was prescient with her song, Hit Me with Your Best Shot!
Andrés Giménez is known for his elite defence. Since Giménez became an everyday player in 2022, Dansby Swanson is the only infielder to post higher OAA and FRV marks. On the basepaths, of 258 qualified players from 2022-2025, Giménez ranks 25th according to FanGraphs BsR. Another area where Giménez ranks among MLB’s best is getting hit by pitches. Consider Table 1. Starting in 2022, Giménez has been hit by a pitch 68 times, second only to Ty France. Looking at PA/HBP, his 29.46 score (as of June 21) ranks fifth lowest. In other words, only four qualified batters have averaged fewer plate appearances before getting hit by a pitch than Giménez. Against right-handed pitchers, he slots in at number five with his 47 HBP (17th in PA/HBP). When facing left-handers, Giménez has absorbed 21 HBPs, MLB’s highest mark and good for the eighth-lowest PA/HBP (26.43). Whether a righty or a lefty is on the mound, Giménez’s motto has been, Hit Me with Your Best Shot. An interesting nugget is the difference between Giménez's HBP scores in counts with fewer than two strikes and with two strikes. Consider Table 2. With fewer than two strikes against him, Giménez has 22 HBPs, which slots in as MLB’s 22nd-highest number since 2022. However, with two strikes, no player has more HBPs than Giménez. For context, I calculated Giménez’s on-base percentage if those 46 HBPs with two strikes were strikeouts. For the 2022-2025 period, his official OBP was .321. If the 46 HBPs were strikeouts instead, his OBP would be .298. That is a notable OBP reduction. Note that I did not calculate PA/HBP for all hitters within the two strikes/fewer than two strikes split because it was too cumbersome to incorporate FanGraphs' (HBP) and Baseball Savant’s (strike counts) data. For those interested, here is a link to MLB’s all-time leaders in the hit-by-pitch category. So, why does Giménez rank so high in the HBP metric? No, I do not believe pitchers dislike Giménez. Perhaps the answer lies in his batting stance. Welcome to a new feature from Baseball Savant! A user can select a player of their choice and the desired period (from 2023 onwards). Below is a screenshot of Giménez’s batting stance for the 2023-2025 period. I encourage the reader to take advantage of Baseball Savant’s Batting Stance tool. One intriguing element is that users can see how a player’s feet move from his batting stance to the pitch release and then to the bat-ball intercept. Let’s see if the batting stance data explains why pitches hit Giménez at a high rate. Behold Table 3. I selected a small sample of left-handed batters to determine if the batting stance data offered clues regarding why Giménez excels at getting hit by pitches. Unfortunately, there is no apparent explanation. Giménez and Bryce Harper have similar depth in the box, and off plate and between feet distances, but quite different stance angles and PA/HBP records. Except for the distance between their feet, Josh Naylor’s characteristics are like Giménez’s stance details. Furthermore, I performed regression analysis for the 2023-2025 period and found limited correlation between PA/HBP data and the listed stance datapoints. The lack of a meaningful correlation could be due to a small sample size. Perhaps there is no meaningful relationship between getting hit by a pitch and batting stance characteristics. Hmm. Perhaps video can help explain the attraction between Giménez's body parts and pitched baseballs. This first clip is from the June 19, 2025, game against Arizona. The pitcher was right-handed, and there were two strikes: In the case below, the pitcher was a left-hander: The final clip captures one of the times Giménez was hit when he played for Cleveland: These three clips show that Giménez does not shy away from inside pitches; he stands his ground and apparently is unafraid to get hit. Other than Giménez’s willingness to be hit, particularly with two strikes, I can offer no other evidence-based reasons why Giménez has been one of the leaders in the hit-by-pitch department. Perhaps it is a gift, just like it was for a famous ballplayer from the past. The Last Word Giménez is an elite defender and an excellent baserunner. Another noteworthy aspect of his play is that he has a top-tier record when it comes to HBPs. He is particularly “hittable” when the count reaches two strikes. Concerning why pitches hit Giménez at a high rate, there are probably multiple contributing factors. One is an apparent willingness to stand his ground and absorb a pitch. In summary, concerning Giménez’s attitude at the plate, Pat Benatar was prescient with her song, Hit Me with Your Best Shot! -
.jpg.c179bfed36879ed9e7e48d78bb7fd90e.jpg) Baserunning, be it stealing bases or taking the extra base, is a critical element of baseball. Players who successfully steal bases, stretch singles into doubles, move from first to third on a single, and execute other baserunning plays contribute positively to a team’s offence. According to Keegan Matheson (@KeeganMatheson), the esteemed author of The Franchise, one of the Blue Jays' management’s 2025 objectives was to improve baserunning: Are the Toronto Blue Jays better baserunners in 2025 compared to 2024 or 2023? Let’s dive into the topic. The first matter to cover is the metrics. FanGraphs publishes Base Running (BsR), the sum of wSB (weighted Stolen Base runs) and Baseball Savant’s XBR. A previous version of BsR used UBR (Ultimate Base Running) instead of XBR and included wGDP (weighted Ground Into Double Play runs). The current BsR model does not reflect the impact of grounding into double plays. For the record, Toronto has a 10.5% GIDP% this season, higher than MLB’s 9.5% and ninth-highest in the league (as of June 15). XBR is a valuable metric because it reflects the value of bases taken and chances not taken. There are 10 situations measured by Baseball Savant, which can be seen by clicking on the "Situation" drop-down menu on the leaderboard. The most frequent scenario captured by XBR is runners stretching a single into a double. Has Toronto’s baserunning improved in 2025? Short Answer: No. Longer Answer: Nope. Please see Table 1 below, and the highlights are as follows: This season, the team has a minus 3.4 BsR (3.4 baserunning runs below average), which ranks 26th as of June 15. In other words, there are just four teams that have produced less value on the basepaths. Regarding each component, Toronto’s -2.1 XBR slots in as 26th-best, and its -1.4 wSB is 19th-best. In 2024 and 2023, Toronto’s BsR ranked 28th and 27th, respectively. Last campaign, Toronto ranked 27th in XBR and 20th in wSB. The season before, the Blue Jays had almost reverse bad splits. Toronto’s XBR and wSB slotted in at #20 and #28, respectively. So, who are the Blue Jays that perform well on the basepaths and those who don’t? Please refer to Table 2. Concerning BsR, as evidenced by the percentile rankings, Andrés Giménez, Myles Straw and George Springer have performed very well this season. Regarding XBR, Ernie Clement has been an elite baserunner, while Daulton Varsho has been below his 2024 and 2023 standards. Varsho has missed considerable time this season due to injuries – he has just 100 plate appearances. However, I expect Varsho will return to his old form on the basepaths. Alejandro Kirk’s zero percentile BsR ranking is unsurprising given his first percentile Sprint Speed. Vladimir Guerrero Jr. and Bo Bichette are interesting baserunners worthy of further examination. Guerrero Jr. Toronto’s $500 million player is a below-average baserunner and was particularly awful in 2023 and 2024. For his career, Guerrero Jr. has attempted 33 stolen bases and succeeded 22 times (67% SB%). His SB% translates into a career -5.4 wSB. Vlad, stop trying to steal bases, you’re below average. Guerrero Jr. is also a poor baserunner in non-steal situations. Please take a look at Table 3. During his career, Guerrero Jr. has an XBR of -10. Although he has added 17 running runs above the average when he successfully advances, that mark is exceeded by his running runs below average when he has been called out at the base (-12) and when he has not taken the chance (-15). In other words, he often tries for an extra base when he probably shouldn’t (-12 thrown out) and does not try to advance when he should (-15 on holds). I conclude that this pattern is consistent with a player who exercises poor judgment on the basepaths. The first scenario, stretching a single into a double, supports my conclusion. This situation accounts for half of his opportunities. Statcast estimates that a generic runner would have attempted an extra base in 32% of those opportunities, but Guerrero Jr. attempted to take an extra base in just 29%. Hence, his decision-making has not been overly aggressive (he should have made more attempts). In terms of baserunning runs, the extra bases he has taken have been negated by the ones he hasn't (+5 versus -5). Guerrero Jr.’s XBR is negative because of unsuccessful attempts (-4). Note that the sum (-4 = +5-4-5) does not add to -3 because of rounding. Bichette Concerning baserunning runs above average, for his career, Table 3 shows that Bichette has been average at taking extra bases. However, starting in 2023, he has been below average at taking extra bases. The more interesting development is Bichette’s decline as a base stealer. Consider Table 4. Bichette’s best season as a base stealer was 2021. He attempted the most steals of his career, with a 96% success rate and a 4.0 wSB. That same season, Bichette’s sprint speed ranked 11th among players his age, and his sprint speed percentile ranking was 75th (among all qualified MLB position players). However, starting in 2022, we have witnessed Bichette’s decline in foot speed. In 2022, his percentile ranking slipped from 2021’s 75th to 54th. Despite the speed deterioration, he attempted to steal 21 bases, but succeeded only 13 times. Hence, Bichette’s wSB fell to -1.3. After 2022, he has not registered a positive wSB season. Other than in 2024, his SB% has not surpassed 63%. Notably, in 2023, MLB’s average SB% was 80%. After the 2021 season, Bichette has posted a below-average base-stealing record, mainly due to a decline in foot speed. It appears that his days as a valuable base stealer are in the past. The Last Word For the 2025 season, Toronto’s management wanted better baserunning from the team. To date, the Blue Jays' baserunning ranks in the bottom third of the league, like it did in 2023 and 2024. One reason that improvement has not occurred is that some of their better baserunners (Varsho and Giménez) have missed considerable time due to injuries. On the good news front, players such as Straw have made positive contributions on the basepaths. Two notable players have had a negative impact on the team’s baserunning record. Guerrero Jr. continues to be below average in taking extra bases and base stealing. His judgment is poor in both elements. Bichette’s record as a base stealer has slipped since 2022, likely due in part to a sprint speed decline. Perhaps with more playing time for the better baserunners and improved judgment from Guerrero Jr., Toronto can become an average baserunning team for the remainder of the 2025 season.
Baserunning, be it stealing bases or taking the extra base, is a critical element of baseball. Players who successfully steal bases, stretch singles into doubles, move from first to third on a single, and execute other baserunning plays contribute positively to a team’s offence. According to Keegan Matheson (@KeeganMatheson), the esteemed author of The Franchise, one of the Blue Jays' management’s 2025 objectives was to improve baserunning: Are the Toronto Blue Jays better baserunners in 2025 compared to 2024 or 2023? Let’s dive into the topic. The first matter to cover is the metrics. FanGraphs publishes Base Running (BsR), the sum of wSB (weighted Stolen Base runs) and Baseball Savant’s XBR. A previous version of BsR used UBR (Ultimate Base Running) instead of XBR and included wGDP (weighted Ground Into Double Play runs). The current BsR model does not reflect the impact of grounding into double plays. For the record, Toronto has a 10.5% GIDP% this season, higher than MLB’s 9.5% and ninth-highest in the league (as of June 15). XBR is a valuable metric because it reflects the value of bases taken and chances not taken. There are 10 situations measured by Baseball Savant, which can be seen by clicking on the "Situation" drop-down menu on the leaderboard. The most frequent scenario captured by XBR is runners stretching a single into a double. Has Toronto’s baserunning improved in 2025? Short Answer: No. Longer Answer: Nope. Please see Table 1 below, and the highlights are as follows: This season, the team has a minus 3.4 BsR (3.4 baserunning runs below average), which ranks 26th as of June 15. In other words, there are just four teams that have produced less value on the basepaths. Regarding each component, Toronto’s -2.1 XBR slots in as 26th-best, and its -1.4 wSB is 19th-best. In 2024 and 2023, Toronto’s BsR ranked 28th and 27th, respectively. Last campaign, Toronto ranked 27th in XBR and 20th in wSB. The season before, the Blue Jays had almost reverse bad splits. Toronto’s XBR and wSB slotted in at #20 and #28, respectively. So, who are the Blue Jays that perform well on the basepaths and those who don’t? Please refer to Table 2. Concerning BsR, as evidenced by the percentile rankings, Andrés Giménez, Myles Straw and George Springer have performed very well this season. Regarding XBR, Ernie Clement has been an elite baserunner, while Daulton Varsho has been below his 2024 and 2023 standards. Varsho has missed considerable time this season due to injuries – he has just 100 plate appearances. However, I expect Varsho will return to his old form on the basepaths. Alejandro Kirk’s zero percentile BsR ranking is unsurprising given his first percentile Sprint Speed. Vladimir Guerrero Jr. and Bo Bichette are interesting baserunners worthy of further examination. Guerrero Jr. Toronto’s $500 million player is a below-average baserunner and was particularly awful in 2023 and 2024. For his career, Guerrero Jr. has attempted 33 stolen bases and succeeded 22 times (67% SB%). His SB% translates into a career -5.4 wSB. Vlad, stop trying to steal bases, you’re below average. Guerrero Jr. is also a poor baserunner in non-steal situations. Please take a look at Table 3. During his career, Guerrero Jr. has an XBR of -10. Although he has added 17 running runs above the average when he successfully advances, that mark is exceeded by his running runs below average when he has been called out at the base (-12) and when he has not taken the chance (-15). In other words, he often tries for an extra base when he probably shouldn’t (-12 thrown out) and does not try to advance when he should (-15 on holds). I conclude that this pattern is consistent with a player who exercises poor judgment on the basepaths. The first scenario, stretching a single into a double, supports my conclusion. This situation accounts for half of his opportunities. Statcast estimates that a generic runner would have attempted an extra base in 32% of those opportunities, but Guerrero Jr. attempted to take an extra base in just 29%. Hence, his decision-making has not been overly aggressive (he should have made more attempts). In terms of baserunning runs, the extra bases he has taken have been negated by the ones he hasn't (+5 versus -5). Guerrero Jr.’s XBR is negative because of unsuccessful attempts (-4). Note that the sum (-4 = +5-4-5) does not add to -3 because of rounding. Bichette Concerning baserunning runs above average, for his career, Table 3 shows that Bichette has been average at taking extra bases. However, starting in 2023, he has been below average at taking extra bases. The more interesting development is Bichette’s decline as a base stealer. Consider Table 4. Bichette’s best season as a base stealer was 2021. He attempted the most steals of his career, with a 96% success rate and a 4.0 wSB. That same season, Bichette’s sprint speed ranked 11th among players his age, and his sprint speed percentile ranking was 75th (among all qualified MLB position players). However, starting in 2022, we have witnessed Bichette’s decline in foot speed. In 2022, his percentile ranking slipped from 2021’s 75th to 54th. Despite the speed deterioration, he attempted to steal 21 bases, but succeeded only 13 times. Hence, Bichette’s wSB fell to -1.3. After 2022, he has not registered a positive wSB season. Other than in 2024, his SB% has not surpassed 63%. Notably, in 2023, MLB’s average SB% was 80%. After the 2021 season, Bichette has posted a below-average base-stealing record, mainly due to a decline in foot speed. It appears that his days as a valuable base stealer are in the past. The Last Word For the 2025 season, Toronto’s management wanted better baserunning from the team. To date, the Blue Jays' baserunning ranks in the bottom third of the league, like it did in 2023 and 2024. One reason that improvement has not occurred is that some of their better baserunners (Varsho and Giménez) have missed considerable time due to injuries. On the good news front, players such as Straw have made positive contributions on the basepaths. Two notable players have had a negative impact on the team’s baserunning record. Guerrero Jr. continues to be below average in taking extra bases and base stealing. His judgment is poor in both elements. Bichette’s record as a base stealer has slipped since 2022, likely due in part to a sprint speed decline. Perhaps with more playing time for the better baserunners and improved judgment from Guerrero Jr., Toronto can become an average baserunning team for the remainder of the 2025 season. -
In recent seasons, the Toronto Blue Jays have been a top-tier defensive team. By the Def metric, Toronto was MLB’s best defensive team (19.1 Def) in 2024, and that ranking has remained unchanged thus far in 2025. An interesting question is whether some pitchers benefit more or less from Toronto’s defence. Table 1 below displays the runs saved according to a selection of metrics, as described below: OAA, Catcher Blocking, Catcher Framing, and Catcher Throwing. Please note that any references to a metric refer to the number of runs saved or prevented equivalent to the metric. For example, Toronto’s 2024 OAA was 24, and the runs-prevented equivalent was 22. Below are some observations: 1. Overall, Toronto’s runs saved by the defence are again MLB’s best this season. 2. Regarding OAA, Toronto’s ranking has slipped from fourth in 2024 to eighth in 2025. Notably, the OAA spread between Toronto’s plus-seven score and the fourth highest (10) is small. Given that approximately one-third of the season has elapsed, Toronto’s projected 2025 21 OAA (7 / 0.33) is similar to 2024’s OAA score. Overall, by the OAA measure, Toronto’s 2025 defence is nearly identical to the 2024 ballclub. 3. However, the OAA changes in the components from 2024 are interesting. Concerning the improved infield performance, both Vladimir Guerrero Jr. and Addison Barger are much better this season. Guerrero Jr.’s 2024 OAA runs prevented were minus seven, and Barger’s were minus four. In 2025, their comparable numbers are plus one and two, respectively. 4. Regarding the outfield’s underperformance vis-à-vis 2024, George Springer’s defence has deteriorated in 2025. Last season, Springer posted zero prevented runs. In this campaign, he has a -6 mark. Also, Daulton Varsho has missed considerable time this season, although Myles Straw’s performance (+4) has partially mitigated Varsho’s absence. 5. Toronto’s catchers are better this season than last. The primary reason is that Danny Jansen, other than Catcher Blocking, was below average in 2024. Tyler Heineman is above average in Catcher Throwing, and average at Catcher Blocking and Catcher Framing. Alejandro Kirk continues to be above average in these catcher metrics. The Defence Beneficiaries So, let’s examine how Blue Jay pitchers have benefited or not from Toronto’s defence. I limited the sample to the ten Blue Jay pitchers with the most innings as of June 3, 2025. Consider Table 2 and Table 3. As I noted earlier, this article is focused on the quality of Toronto’s defence when specific pitchers are on the mound. For the sake of simplicity, I have ignored the defensive contributions of pitchers when they are pitching. Those contributions include how well they field their position and their consistency in hitting the targeted spot (missing the target by a wide margin can negatively affect a catcher’s ability to frame pitches). Unsurprisingly, starters benefit more from Toronto’s elite defence because they log more innings and throw more pitches than relievers. This observation aligns with the total number of saved runs by the pitcher. For this reason, I split the pitchers into two groups, starters and relievers. The items of interest include the following: 1. In 2025, Toronto’s starters have benefited from improved infield defence. For the starters listed, the total OAA runs prevented number is plus nine, higher than 2024’s plus three. 2. Concerning outfield defence, the team’s OAA runs prevented score ranks #14. Last season, the total runs saved for the listed starters was +14; this season, it is plus three. The innings pitched by these starters to date are 45% of their 2024 innings. Accordingly, I projected the 2025 total to be 7 (3 divided by 0.45), which is half of 2024’s total. Overall, the outfielders better served Toronto’s 2024 pitchers than the 2025 group. 3. It is noteworthy that Chris Bassitt has not benefited from better infield play. Despite increasing his GB% from 2024’s 40.3 to 46.2 in 2025, the runs saved are zero. 4. Also, on balls in play hit towards the pitcher or other infielders, Bassitt’s 2025 xBA against is 0.190, and the BA is 0.067, a 0.123 differential (0.190 less 0.067). 5. For comparison, Kevin Gausman’s 2025 xBA and BA on similar batted balls are 0.252 and 0.064, respectively. The difference is 0.188. So, due to luck or other factors, Gausman and Bassitt have nearly identical batting average (BA) numbers, yet Bassitt has a much better xBA (0.190 versus 0.252). 6. Perhaps the explanation of Bassitt’s relative lack of quality infield defence is that opposition batters are following the advice of Willie Keeler. 7. Another anomaly is Gausman’s relatively lesser share of Catcher Framing benefits. More work is needed, but I will note that Gausman’s strike rate in 2025 and 2024 were 47.7% and 45.9%, respectively. The 2025 strike rate for Jose Berrios is 54.9%, and 52.5% in 2024. The Running Game For purposes of evaluating a catcher’s ability to defend against stolen bases, Baseball Savant’s Catcher Throwing metric is vastly superior to the Caught Stealing% (“CS%”) datapoint. CS% does not isolate baserunner speed, lead distance, pitch velocity and location, pitcher handedness, and other factors. For the record, Toronto’s CS% was 23.6 in 2024, MLB’s eighth best. In 2025, the CS% is 32.1, MLB’s fifth best. Unfortunately, Baseball Savant does not offer catcher throwing data by pitcher. However, we can examine a pitcher’s contribution to defending the opposition’s running game. For this article, my focus is on the ability of Toronto’s pitchers to restrict the lead distance of opposition baserunners, be it as a base stealer or not. The importance of a reduced lead for a base stealer is obvious. However, the longer a baserunner’s lead in a non-steal situation, the higher the probability that, for example, the runner will be safe at the next base or disrupt a potential double play. The lead distance data does not distinguish between baserunner characteristics, such as whether the runner is a base stealer or how aggressively the runner takes a lead from the base. Furthermore, for purposes of this analysis, I will assume that, if a pitcher’s average baserunner lead is less than the MLB average, the pitcher does a better-than-average job of holding runners. If the average lead is higher, the pitcher does a below-average job of holding runners. Lo and behold, Table 4 and Table 5. Below are some observations: 1. The first thing to note is that when Bowden Francis is on the mound this season, there have been no stolen base attempts. Okay, as one wag noted, why try to steal a base when Francis is pitching when you can wait for the home run? Notably, Francis’s HR/PA% has jumped to 6.7 in 2025. 2. However, last season, when Francis had a 4.2 HR/PA%, slightly higher than MLB’s 3.0 HR/PA%, there was one stolen base attempt in 474 stolen base opportunities. 3. The MLB average stolen base attempt percentage was 1.4 (stolen base attempts divided by stolen base opportunities). Accordingly, based on the MLB average rate, there should have been seven attempts when Bowden was on the mound. 4. The average leads when Francis makes his first move, and when he releases the ball, are better than the MLB Average. Accordingly, it appears that runners do not get a good read when Francis is on the mound. 5. Yariel Rodriguez is terrible at holding runners. The average lead when the pitch is released, be it in stolen base opportunities or stolen base attempts, is much higher than the MLB Average. 6. Generally speaking, in stolen-base opportunities and stolen base attempts, Toronto pitchers are better this season than last at restricting baserunner leads. If you want proof, please compare Table 4 to Table 5; there is significantly more green in Table 4 than in Table 5. The Last Word The Toronto Blue Jays continue to excel at defence. An individual starter benefits more from the stellar defence than a reliever because a starter registers more innings and pitches. There are some anomalies, such as the lesser infield defence experienced by Bassitt compared to the other starters, and Gausman’s lesser share of the Catcher Framing spoils. Lastly, Toronto’s pitchers are generally better this season than last at limiting the leads that opposition baserunners take when on the basepaths. View full article
- 1 reply
-
- 1
-

-
- kevin gausman
- chris bassitt
- (and 7 more)
-
Which Pitchers Have Benefited The Most From Toronto’s Premier Defence?
Bob Ritchie posted an article in Blue Jays
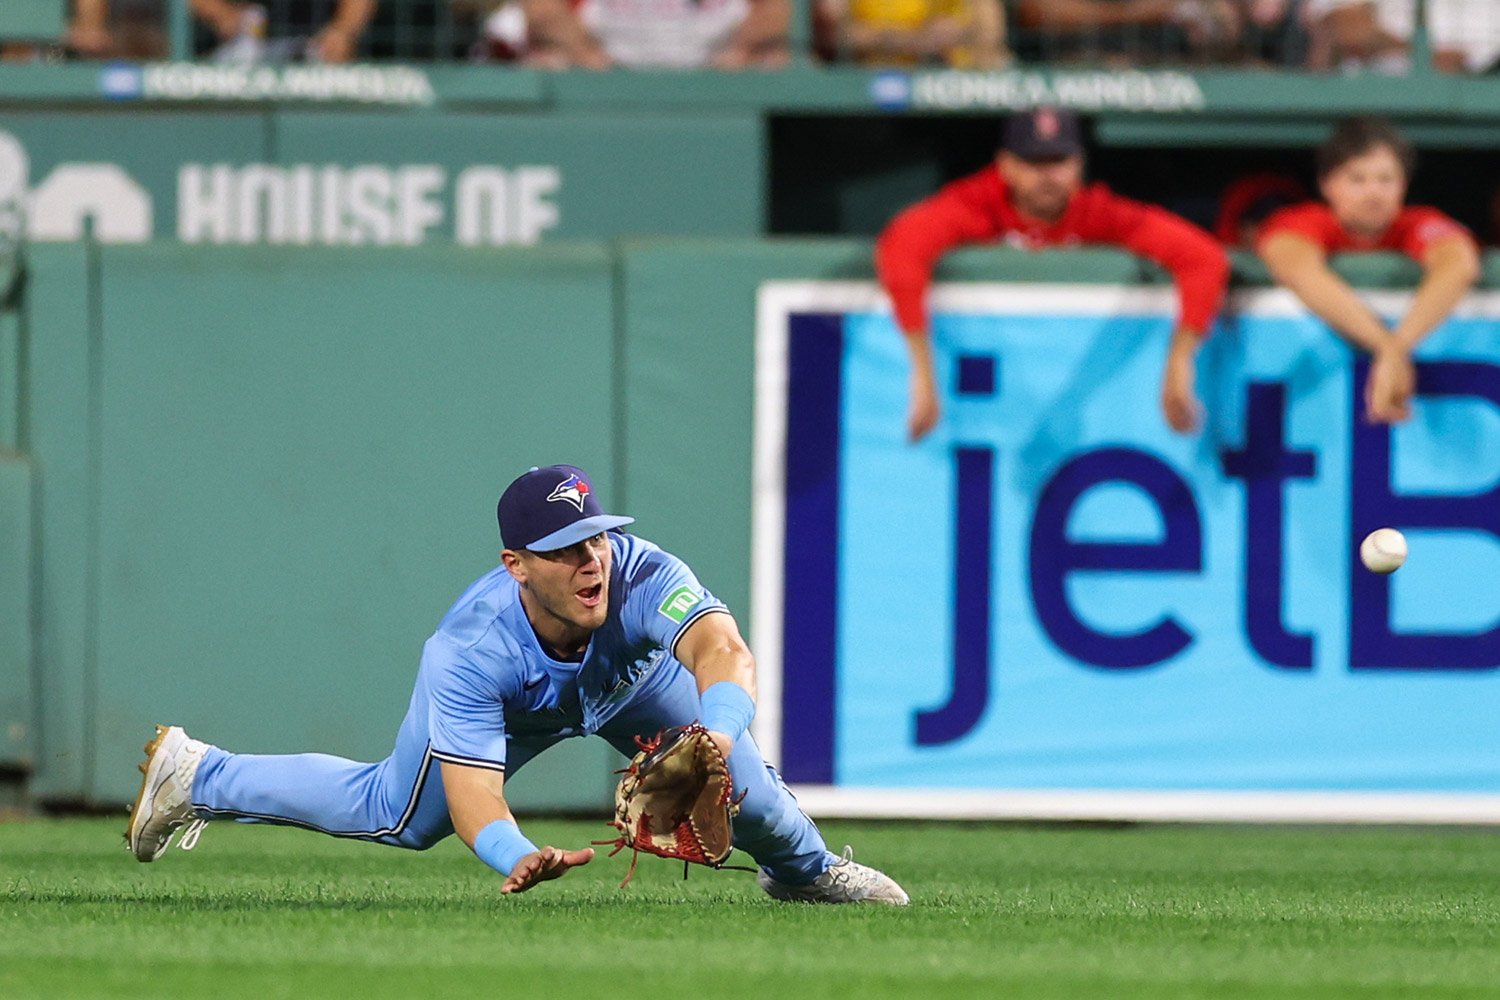 In recent seasons, the Toronto Blue Jays have been a top-tier defensive team. By the Def metric, Toronto was MLB’s best defensive team (19.1 Def) in 2024, and that ranking has remained unchanged thus far in 2025. An interesting question is whether some pitchers benefit more or less from Toronto’s defence. Table 1 below displays the runs saved according to a selection of metrics, as described below: OAA, Catcher Blocking, Catcher Framing, and Catcher Throwing. Please note that any references to a metric refer to the number of runs saved or prevented equivalent to the metric. For example, Toronto’s 2024 OAA was 24, and the runs-prevented equivalent was 22. Below are some observations: 1. Overall, Toronto’s runs saved by the defence are again MLB’s best this season. 2. Regarding OAA, Toronto’s ranking has slipped from fourth in 2024 to eighth in 2025. Notably, the OAA spread between Toronto’s plus-seven score and the fourth highest (10) is small. Given that approximately one-third of the season has elapsed, Toronto’s projected 2025 21 OAA (7 / 0.33) is similar to 2024’s OAA score. Overall, by the OAA measure, Toronto’s 2025 defence is nearly identical to the 2024 ballclub. 3. However, the OAA changes in the components from 2024 are interesting. Concerning the improved infield performance, both Vladimir Guerrero Jr. and Addison Barger are much better this season. Guerrero Jr.’s 2024 OAA runs prevented were minus seven, and Barger’s were minus four. In 2025, their comparable numbers are plus one and two, respectively. 4. Regarding the outfield’s underperformance vis-à-vis 2024, George Springer’s defence has deteriorated in 2025. Last season, Springer posted zero prevented runs. In this campaign, he has a -6 mark. Also, Daulton Varsho has missed considerable time this season, although Myles Straw’s performance (+4) has partially mitigated Varsho’s absence. 5. Toronto’s catchers are better this season than last. The primary reason is that Danny Jansen, other than Catcher Blocking, was below average in 2024. Tyler Heineman is above average in Catcher Throwing, and average at Catcher Blocking and Catcher Framing. Alejandro Kirk continues to be above average in these catcher metrics. The Defence Beneficiaries So, let’s examine how Blue Jay pitchers have benefited or not from Toronto’s defence. I limited the sample to the ten Blue Jay pitchers with the most innings as of June 3, 2025. Consider Table 2 and Table 3. As I noted earlier, this article is focused on the quality of Toronto’s defence when specific pitchers are on the mound. For the sake of simplicity, I have ignored the defensive contributions of pitchers when they are pitching. Those contributions include how well they field their position and their consistency in hitting the targeted spot (missing the target by a wide margin can negatively affect a catcher’s ability to frame pitches). Unsurprisingly, starters benefit more from Toronto’s elite defence because they log more innings and throw more pitches than relievers. This observation aligns with the total number of saved runs by the pitcher. For this reason, I split the pitchers into two groups, starters and relievers. The items of interest include the following: 1. In 2025, Toronto’s starters have benefited from improved infield defence. For the starters listed, the total OAA runs prevented number is plus nine, higher than 2024’s plus three. 2. Concerning outfield defence, the team’s OAA runs prevented score ranks #14. Last season, the total runs saved for the listed starters was +14; this season, it is plus three. The innings pitched by these starters to date are 45% of their 2024 innings. Accordingly, I projected the 2025 total to be 7 (3 divided by 0.45), which is half of 2024’s total. Overall, the outfielders better served Toronto’s 2024 pitchers than the 2025 group. 3. It is noteworthy that Chris Bassitt has not benefited from better infield play. Despite increasing his GB% from 2024’s 40.3 to 46.2 in 2025, the runs saved are zero. 4. Also, on balls in play hit towards the pitcher or other infielders, Bassitt’s 2025 xBA against is 0.190, and the BA is 0.067, a 0.123 differential (0.190 less 0.067). 5. For comparison, Kevin Gausman’s 2025 xBA and BA on similar batted balls are 0.252 and 0.064, respectively. The difference is 0.188. So, due to luck or other factors, Gausman and Bassitt have nearly identical batting average (BA) numbers, yet Bassitt has a much better xBA (0.190 versus 0.252). 6. Perhaps the explanation of Bassitt’s relative lack of quality infield defence is that opposition batters are following the advice of Willie Keeler. 7. Another anomaly is Gausman’s relatively lesser share of Catcher Framing benefits. More work is needed, but I will note that Gausman’s strike rate in 2025 and 2024 were 47.7% and 45.9%, respectively. The 2025 strike rate for Jose Berrios is 54.9%, and 52.5% in 2024. The Running Game For purposes of evaluating a catcher’s ability to defend against stolen bases, Baseball Savant’s Catcher Throwing metric is vastly superior to the Caught Stealing% (“CS%”) datapoint. CS% does not isolate baserunner speed, lead distance, pitch velocity and location, pitcher handedness, and other factors. For the record, Toronto’s CS% was 23.6 in 2024, MLB’s eighth best. In 2025, the CS% is 32.1, MLB’s fifth best. Unfortunately, Baseball Savant does not offer catcher throwing data by pitcher. However, we can examine a pitcher’s contribution to defending the opposition’s running game. For this article, my focus is on the ability of Toronto’s pitchers to restrict the lead distance of opposition baserunners, be it as a base stealer or not. The importance of a reduced lead for a base stealer is obvious. However, the longer a baserunner’s lead in a non-steal situation, the higher the probability that, for example, the runner will be safe at the next base or disrupt a potential double play. The lead distance data does not distinguish between baserunner characteristics, such as whether the runner is a base stealer or how aggressively the runner takes a lead from the base. Furthermore, for purposes of this analysis, I will assume that, if a pitcher’s average baserunner lead is less than the MLB average, the pitcher does a better-than-average job of holding runners. If the average lead is higher, the pitcher does a below-average job of holding runners. Lo and behold, Table 4 and Table 5. Below are some observations: 1. The first thing to note is that when Bowden Francis is on the mound this season, there have been no stolen base attempts. Okay, as one wag noted, why try to steal a base when Francis is pitching when you can wait for the home run? Notably, Francis’s HR/PA% has jumped to 6.7 in 2025. 2. However, last season, when Francis had a 4.2 HR/PA%, slightly higher than MLB’s 3.0 HR/PA%, there was one stolen base attempt in 474 stolen base opportunities. 3. The MLB average stolen base attempt percentage was 1.4 (stolen base attempts divided by stolen base opportunities). Accordingly, based on the MLB average rate, there should have been seven attempts when Bowden was on the mound. 4. The average leads when Francis makes his first move, and when he releases the ball, are better than the MLB Average. Accordingly, it appears that runners do not get a good read when Francis is on the mound. 5. Yariel Rodriguez is terrible at holding runners. The average lead when the pitch is released, be it in stolen base opportunities or stolen base attempts, is much higher than the MLB Average. 6. Generally speaking, in stolen-base opportunities and stolen base attempts, Toronto pitchers are better this season than last at restricting baserunner leads. If you want proof, please compare Table 4 to Table 5; there is significantly more green in Table 4 than in Table 5. The Last Word The Toronto Blue Jays continue to excel at defence. An individual starter benefits more from the stellar defence than a reliever because a starter registers more innings and pitches. There are some anomalies, such as the lesser infield defence experienced by Bassitt compared to the other starters, and Gausman’s lesser share of the Catcher Framing spoils. Lastly, Toronto’s pitchers are generally better this season than last at limiting the leads that opposition baserunners take when on the basepaths.
- 1 comment
-
- 2
-
-

-
- kevin gausman
- chris bassitt
- (and 7 more)
-
Article: Is Bo Bichette No Longer a Lefty Masher?
Bob Ritchie replied to Bob Ritchie's topic in Jays Centre Front Page News
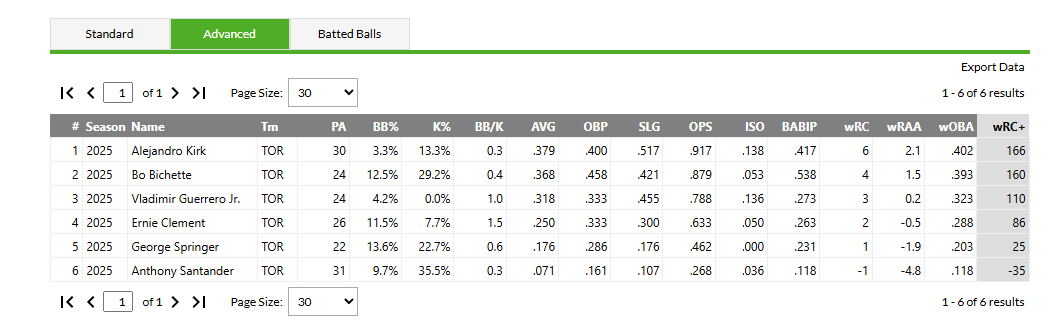
Bichette has performed well with RISP and in high-leverage situations this season. The MLB Average OPS with RISP is 0.723. In high-leverage situations, the MLB Average OPS is 0.693. Below are Toronto's batting metrics with RISP and in high-leverage situations before last night's game. The RISP table is first.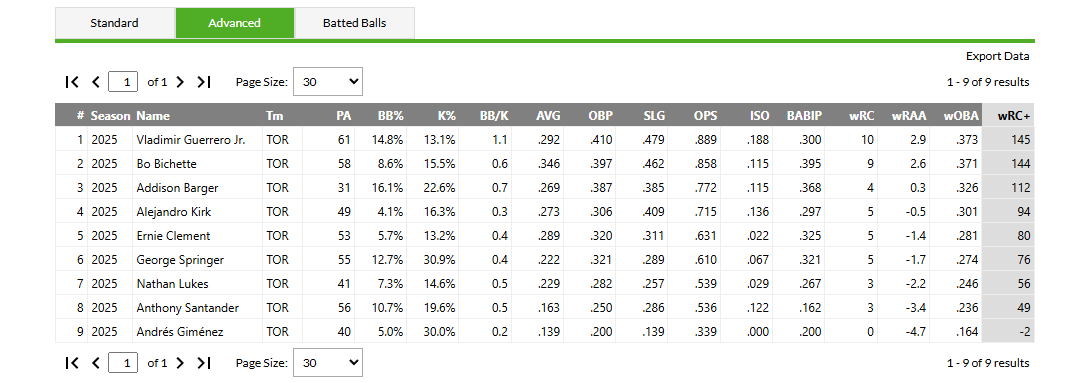
-
Article: Is 2025 Daulton Varsho For Real?
Bob Ritchie replied to Jim Scott's topic in Jays Centre Front Page News
Baseball-Reference, Spotrac and Cot's Contracts (part of Baseball Prospectus) all show ISE Baseball as his agent. Also, Boras Corp posted messages in 2023 concerning Varsho. For Varsho to have switched to Boras would mean that ISE was Varsho's agent before August 2023, and Baseball-Reference and the other websites did not update their information accordingly. I am doubtful that all three websites have not changed the agent information in almost two years, at the very least. I may be incorrect about Varsho and ISE, but the evidence is more persuasive that ISE is his agent, and not Boras.
-
.jpg.67edd51d553c67e51a1c6a0fd6ee16c7.jpg) On Wednesday, May 21, Will Harris posted a table on Bluesky that showed Bo Bichette had the lowest OPS (.434 as of May 21) among batters with at least 100 plate appearances against left-handed pitchers since 2024. Considering that before the 2024 season, Bichette posted a career .908 OPS and 147 wRC+ against left-handed pitchers, the .434 OPS was surprising. Why has Bichette’s performance against lefties lagged behind his pre-2024 record? Let’s take a look. For context, in 2024, 27% of all plate appearances occurred when a hitter faced a lefty. Therefore, it is more important that a full-time position player perform well against righties than lefties. Nonetheless, Bichette’s OPS against left-handed pitchers is well below MLB’s comparable 2024-2025 average of .718 OPS. His underperformance is a red flag. I included Bichette’s performance against right-handed pitchers for the analysis because it may offer some insights regarding his numbers facing lefties. Additionally, this study focuses on expected metrics (for example, xSLG) because these statistics eliminate the impact of defence (good or bad) that may distort how well or poorly Bichette has batted. Table 1 shows Bichette’s performance by pitcher handedness. Concerning his metrics when facing right-handed pitchers, except for xISO, Bichette’s 2025 x-stats are superior to his pre-2024 numbers. The difference between the 2025 xISO and the 2019-2023 mark is insignificant. Furthermore, every 2025 x-stat exceeds the relevant box score number (xBA exceeds BA, xSLG exceeds SLG, etc.). Hence, against righties, Bichette is hitting very well this season. Also, Bichette’s batting in 2024 was poor because of injuries and other factors. Regarding performance versus left-handers, my focus is on the 2024-2025 period because the 2025 sample is small (37 plate appearances). Also, the genesis of this article was the .434 OPS against lefthanders since 2024. I used the 2025 data vis-à-vis right-handers because the sample size was sufficient (188 plate appearances). Concerning Bichette’s 2024-2025 batting metrics against lefties, three noteworthy reasons exist for the underperformance: bad luck, poor plate discipline, and difficulty hitting all pitch types, particularly off-speed and breaking pitches. Bad Luck When facing left-handers, Bichette’s 2024-2025 x-stats, as depicted in Table 1, considerably exceed the relevant box score metric. Furthermore, his 2024-2025 xOPS is .732, much better than the highlighted .434 OPS (.421 OPS as of May 27). Therefore, part of the reason why Bichette’s OPS against left-handers is underwhelming is bad luck. We should expect his 2025 box score performance against lefties to improve due to positive regression. Plate Discipline Table 2 shows Bichette’s plate discipline versus left-handers and right-handers. Table 3 depicts plate discipline by pitch type and pitcher handedness. My observations are as follows: Compared to the pre-2024 period, the 2024-2025 Bichette is chasing at a higher rate when facing left-handers but making contact at a lower rate. His In-Zone Swing% is similar to 2019-2023 Bichette, but his In-Zone Contact% is higher. Bichette’s chase and in-zone contact rates on non-fastballs have markedly declined since 2024. Performance by Pitch Types Table 4 shows pitch mix and Whiff% data by pitcher handedness. Tables 5 and 6 depict Bichette's performance against fastballs and non-fastballs, respectively. Concerning pitch mix offered by right-handers, there has been little change in 2025 compared to previous periods. However, against left-handers, Bichette has faced a higher allocation of fastballs in 2024-2025 compared to 2019-2023. Fastballs Bichette’s fastball performance against lefties during 2024-2025 lags behind 2019-2023. However, his 2025 x-stat performance against right-handed pitchers' fastballs is better than the 2024-2025 and 2019-2023 periods. Also, concerning fastball performance against left-handers, his 2024-2025 xOBP and xwOBA marks are lower than the 2019-2023 marks because his 2019-2023 11.2 BB% exceeds his 2024-2025 4.1 BB%. Accordingly, Bichette’s underperformance on fastballs when facing left-handers is not a concern because his performance versus righties demonstrates that he can handle fastballs. Additionally, I expect Bichette’s walk rate to normalize going forward. Off-Speed and Breaking Pitches Bichette’s 2025 x-stats on non-fastballs versus right-handers are similar to 2019-2023. Therefore, as I noted in respect of fastball performance when facing right-handers, this season’s Bichette can hit off-speed and breaking pitches thrown by righties. The question is why Bichette has struggled to hit off-speed and breaking pitches offered by lefties. One possibility is that, against lefties, Bichette is hunting fastballs more in 2024-2025 than in 2019-2023. The supporting evidence is as follows: Compared to 2019-2023, 2024-2025 Bichette has a higher fastball Chase% (35.8% versus 28.8%). His 2024-2025 fastball Swing% (all zones) is 60.5%, higher than 2019-2023’s 56.6% Swing%. The left-hander/right-hander fastball In-Zone Swing% spread has increased since 2024. The spread increased from 6.4 percentage points (80.5% less 74.1%) to 8.2 (78.2% less 70.0%). Put another way, compared to 2019-2023, Bichette’s 2024-2025 In-Zone Swing% versus lefties has declined less than his comparable rate against righties. Bichette's fastball 2024-2025 In-Zone Contact% jumped from 84.4% in 2019-2023 to 96.5%. Look fastball, see fastball, hit fastball. Since 2024, 69% of the pitches offered to him by left-handed pitchers are fastballs, up from 57% in 2019-2023. In other words, if Bichette is seeing a lot more fastballs, it makes sense to look for fastballs. Therefore, if a batter is hunting fastballs, we should expect lower contact rates on non-fastballs because the batter is fooled more often due to the slower speed and more movement on off-speed and breaking pitches. The data support this expectation. When facing left-handed pitchers, Bichette's 2019-2023 non-fastball Chase Contact% dropped from 61.7% to 45.2%, and his In-Zone Contact% declined from 87.7% to 80.0% in 2024-2025. Also, when a pitch fools a batter, weaker contact should occur. And it does! Bichette’s 2024-2025 .245 xSLG is less than half of 2019-2023’s .525 xSLG. In summary, if my hunting-more-fastballs theory is correct, Bichette’s performance against left-handers has suffered. He is making contact on non-fastballs at a lower rate, and his contact is weaker. It would appear that a more balanced pitch-selection approach may put Bichette back on the lefty masher path. The Last Word Since 2024, Bichette has struggled against left-handed pitchers. His OPS is well below the mark he posted before 2024. There are three reasons why Bichette’s performance against lefties lags behind the 2019-2023 period, namely bad luck, less discipline, and, it would appear, hunting fastballs at a higher rate than before. With the helpful hand of Lady Luck, better plate discipline, and less fastball hunting, Bichette’s performance when facing left-handed pitchers should return to his pre-2024 level.
On Wednesday, May 21, Will Harris posted a table on Bluesky that showed Bo Bichette had the lowest OPS (.434 as of May 21) among batters with at least 100 plate appearances against left-handed pitchers since 2024. Considering that before the 2024 season, Bichette posted a career .908 OPS and 147 wRC+ against left-handed pitchers, the .434 OPS was surprising. Why has Bichette’s performance against lefties lagged behind his pre-2024 record? Let’s take a look. For context, in 2024, 27% of all plate appearances occurred when a hitter faced a lefty. Therefore, it is more important that a full-time position player perform well against righties than lefties. Nonetheless, Bichette’s OPS against left-handed pitchers is well below MLB’s comparable 2024-2025 average of .718 OPS. His underperformance is a red flag. I included Bichette’s performance against right-handed pitchers for the analysis because it may offer some insights regarding his numbers facing lefties. Additionally, this study focuses on expected metrics (for example, xSLG) because these statistics eliminate the impact of defence (good or bad) that may distort how well or poorly Bichette has batted. Table 1 shows Bichette’s performance by pitcher handedness. Concerning his metrics when facing right-handed pitchers, except for xISO, Bichette’s 2025 x-stats are superior to his pre-2024 numbers. The difference between the 2025 xISO and the 2019-2023 mark is insignificant. Furthermore, every 2025 x-stat exceeds the relevant box score number (xBA exceeds BA, xSLG exceeds SLG, etc.). Hence, against righties, Bichette is hitting very well this season. Also, Bichette’s batting in 2024 was poor because of injuries and other factors. Regarding performance versus left-handers, my focus is on the 2024-2025 period because the 2025 sample is small (37 plate appearances). Also, the genesis of this article was the .434 OPS against lefthanders since 2024. I used the 2025 data vis-à-vis right-handers because the sample size was sufficient (188 plate appearances). Concerning Bichette’s 2024-2025 batting metrics against lefties, three noteworthy reasons exist for the underperformance: bad luck, poor plate discipline, and difficulty hitting all pitch types, particularly off-speed and breaking pitches. Bad Luck When facing left-handers, Bichette’s 2024-2025 x-stats, as depicted in Table 1, considerably exceed the relevant box score metric. Furthermore, his 2024-2025 xOPS is .732, much better than the highlighted .434 OPS (.421 OPS as of May 27). Therefore, part of the reason why Bichette’s OPS against left-handers is underwhelming is bad luck. We should expect his 2025 box score performance against lefties to improve due to positive regression. Plate Discipline Table 2 shows Bichette’s plate discipline versus left-handers and right-handers. Table 3 depicts plate discipline by pitch type and pitcher handedness. My observations are as follows: Compared to the pre-2024 period, the 2024-2025 Bichette is chasing at a higher rate when facing left-handers but making contact at a lower rate. His In-Zone Swing% is similar to 2019-2023 Bichette, but his In-Zone Contact% is higher. Bichette’s chase and in-zone contact rates on non-fastballs have markedly declined since 2024. Performance by Pitch Types Table 4 shows pitch mix and Whiff% data by pitcher handedness. Tables 5 and 6 depict Bichette's performance against fastballs and non-fastballs, respectively. Concerning pitch mix offered by right-handers, there has been little change in 2025 compared to previous periods. However, against left-handers, Bichette has faced a higher allocation of fastballs in 2024-2025 compared to 2019-2023. Fastballs Bichette’s fastball performance against lefties during 2024-2025 lags behind 2019-2023. However, his 2025 x-stat performance against right-handed pitchers' fastballs is better than the 2024-2025 and 2019-2023 periods. Also, concerning fastball performance against left-handers, his 2024-2025 xOBP and xwOBA marks are lower than the 2019-2023 marks because his 2019-2023 11.2 BB% exceeds his 2024-2025 4.1 BB%. Accordingly, Bichette’s underperformance on fastballs when facing left-handers is not a concern because his performance versus righties demonstrates that he can handle fastballs. Additionally, I expect Bichette’s walk rate to normalize going forward. Off-Speed and Breaking Pitches Bichette’s 2025 x-stats on non-fastballs versus right-handers are similar to 2019-2023. Therefore, as I noted in respect of fastball performance when facing right-handers, this season’s Bichette can hit off-speed and breaking pitches thrown by righties. The question is why Bichette has struggled to hit off-speed and breaking pitches offered by lefties. One possibility is that, against lefties, Bichette is hunting fastballs more in 2024-2025 than in 2019-2023. The supporting evidence is as follows: Compared to 2019-2023, 2024-2025 Bichette has a higher fastball Chase% (35.8% versus 28.8%). His 2024-2025 fastball Swing% (all zones) is 60.5%, higher than 2019-2023’s 56.6% Swing%. The left-hander/right-hander fastball In-Zone Swing% spread has increased since 2024. The spread increased from 6.4 percentage points (80.5% less 74.1%) to 8.2 (78.2% less 70.0%). Put another way, compared to 2019-2023, Bichette’s 2024-2025 In-Zone Swing% versus lefties has declined less than his comparable rate against righties. Bichette's fastball 2024-2025 In-Zone Contact% jumped from 84.4% in 2019-2023 to 96.5%. Look fastball, see fastball, hit fastball. Since 2024, 69% of the pitches offered to him by left-handed pitchers are fastballs, up from 57% in 2019-2023. In other words, if Bichette is seeing a lot more fastballs, it makes sense to look for fastballs. Therefore, if a batter is hunting fastballs, we should expect lower contact rates on non-fastballs because the batter is fooled more often due to the slower speed and more movement on off-speed and breaking pitches. The data support this expectation. When facing left-handed pitchers, Bichette's 2019-2023 non-fastball Chase Contact% dropped from 61.7% to 45.2%, and his In-Zone Contact% declined from 87.7% to 80.0% in 2024-2025. Also, when a pitch fools a batter, weaker contact should occur. And it does! Bichette’s 2024-2025 .245 xSLG is less than half of 2019-2023’s .525 xSLG. In summary, if my hunting-more-fastballs theory is correct, Bichette’s performance against left-handers has suffered. He is making contact on non-fastballs at a lower rate, and his contact is weaker. It would appear that a more balanced pitch-selection approach may put Bichette back on the lefty masher path. The Last Word Since 2024, Bichette has struggled against left-handed pitchers. His OPS is well below the mark he posted before 2024. There are three reasons why Bichette’s performance against lefties lags behind the 2019-2023 period, namely bad luck, less discipline, and, it would appear, hunting fastballs at a higher rate than before. With the helpful hand of Lady Luck, better plate discipline, and less fastball hunting, Bichette’s performance when facing left-handed pitchers should return to his pre-2024 level. -
On Wednesday, May 21, Will Harris posted a table on Bluesky that showed Bo Bichette had the lowest OPS (.434 as of May 21) among batters with at least 100 plate appearances against left-handed pitchers since 2024. Considering that before the 2024 season, Bichette posted a career .908 OPS and 147 wRC+ against left-handed pitchers, the .434 OPS was surprising. Why has Bichette’s performance against lefties lagged behind his pre-2024 record? Let’s take a look. For context, in 2024, 27% of all plate appearances occurred when a hitter faced a lefty. Therefore, it is more important that a full-time position player perform well against righties than lefties. Nonetheless, Bichette’s OPS against left-handed pitchers is well below MLB’s comparable 2024-2025 average of .718 OPS. His underperformance is a red flag. I included Bichette’s performance against right-handed pitchers for the analysis because it may offer some insights regarding his numbers facing lefties. Additionally, this study focuses on expected metrics (for example, xSLG) because these statistics eliminate the impact of defence (good or bad) that may distort how well or poorly Bichette has batted. Table 1 shows Bichette’s performance by pitcher handedness. Concerning his metrics when facing right-handed pitchers, except for xISO, Bichette’s 2025 x-stats are superior to his pre-2024 numbers. The difference between the 2025 xISO and the 2019-2023 mark is insignificant. Furthermore, every 2025 x-stat exceeds the relevant box score number (xBA exceeds BA, xSLG exceeds SLG, etc.). Hence, against righties, Bichette is hitting very well this season. Also, Bichette’s batting in 2024 was poor because of injuries and other factors. Regarding performance versus left-handers, my focus is on the 2024-2025 period because the 2025 sample is small (37 plate appearances). Also, the genesis of this article was the .434 OPS against lefthanders since 2024. I used the 2025 data vis-à-vis right-handers because the sample size was sufficient (188 plate appearances). Concerning Bichette’s 2024-2025 batting metrics against lefties, three noteworthy reasons exist for the underperformance: bad luck, poor plate discipline, and difficulty hitting all pitch types, particularly off-speed and breaking pitches. Bad Luck When facing left-handers, Bichette’s 2024-2025 x-stats, as depicted in Table 1, considerably exceed the relevant box score metric. Furthermore, his 2024-2025 xOPS is .732, much better than the highlighted .434 OPS (.421 OPS as of May 27). Therefore, part of the reason why Bichette’s OPS against left-handers is underwhelming is bad luck. We should expect his 2025 box score performance against lefties to improve due to positive regression. Plate Discipline Table 2 shows Bichette’s plate discipline versus left-handers and right-handers. Table 3 depicts plate discipline by pitch type and pitcher handedness. My observations are as follows: Compared to the pre-2024 period, the 2024-2025 Bichette is chasing at a higher rate when facing left-handers but making contact at a lower rate. His In-Zone Swing% is similar to 2019-2023 Bichette, but his In-Zone Contact% is higher. Bichette’s chase and in-zone contact rates on non-fastballs have markedly declined since 2024. Performance by Pitch Types Table 4 shows pitch mix and Whiff% data by pitcher handedness. Tables 5 and 6 depict Bichette's performance against fastballs and non-fastballs, respectively. Concerning pitch mix offered by right-handers, there has been little change in 2025 compared to previous periods. However, against left-handers, Bichette has faced a higher allocation of fastballs in 2024-2025 compared to 2019-2023. Fastballs Bichette’s fastball performance against lefties during 2024-2025 lags behind 2019-2023. However, his 2025 x-stat performance against right-handed pitchers' fastballs is better than the 2024-2025 and 2019-2023 periods. Also, concerning fastball performance against left-handers, his 2024-2025 xOBP and xwOBA marks are lower than the 2019-2023 marks because his 2019-2023 11.2 BB% exceeds his 2024-2025 4.1 BB%. Accordingly, Bichette’s underperformance on fastballs when facing left-handers is not a concern because his performance versus righties demonstrates that he can handle fastballs. Additionally, I expect Bichette’s walk rate to normalize going forward. Off-Speed and Breaking Pitches Bichette’s 2025 x-stats on non-fastballs versus right-handers are similar to 2019-2023. Therefore, as I noted in respect of fastball performance when facing right-handers, this season’s Bichette can hit off-speed and breaking pitches thrown by righties. The question is why Bichette has struggled to hit off-speed and breaking pitches offered by lefties. One possibility is that, against lefties, Bichette is hunting fastballs more in 2024-2025 than in 2019-2023. The supporting evidence is as follows: Compared to 2019-2023, 2024-2025 Bichette has a higher fastball Chase% (35.8% versus 28.8%). His 2024-2025 fastball Swing% (all zones) is 60.5%, higher than 2019-2023’s 56.6% Swing%. The left-hander/right-hander fastball In-Zone Swing% spread has increased since 2024. The spread increased from 6.4 percentage points (80.5% less 74.1%) to 8.2 (78.2% less 70.0%). Put another way, compared to 2019-2023, Bichette’s 2024-2025 In-Zone Swing% versus lefties has declined less than his comparable rate against righties. Bichette's fastball 2024-2025 In-Zone Contact% jumped from 84.4% in 2019-2023 to 96.5%. Look fastball, see fastball, hit fastball. Since 2024, 69% of the pitches offered to him by left-handed pitchers are fastballs, up from 57% in 2019-2023. In other words, if Bichette is seeing a lot more fastballs, it makes sense to look for fastballs. Therefore, if a batter is hunting fastballs, we should expect lower contact rates on non-fastballs because the batter is fooled more often due to the slower speed and more movement on off-speed and breaking pitches. The data support this expectation. When facing left-handed pitchers, Bichette's 2019-2023 non-fastball Chase Contact% dropped from 61.7% to 45.2%, and his In-Zone Contact% declined from 87.7% to 80.0% in 2024-2025. Also, when a pitch fools a batter, weaker contact should occur. And it does! Bichette’s 2024-2025 .245 xSLG is less than half of 2019-2023’s .525 xSLG. In summary, if my hunting-more-fastballs theory is correct, Bichette’s performance against left-handers has suffered. He is making contact on non-fastballs at a lower rate, and his contact is weaker. It would appear that a more balanced pitch-selection approach may put Bichette back on the lefty masher path. The Last Word Since 2024, Bichette has struggled against left-handed pitchers. His OPS is well below the mark he posted before 2024. There are three reasons why Bichette’s performance against lefties lags behind the 2019-2023 period, namely bad luck, less discipline, and, it would appear, hunting fastballs at a higher rate than before. With the helpful hand of Lady Luck, better plate discipline, and less fastball hunting, Bichette’s performance when facing left-handed pitchers should return to his pre-2024 level. View full article
-
Article: Is 2025 Daulton Varsho For Real?
Bob Ritchie replied to Jim Scott's topic in Jays Centre Front Page News
According to Baseball Reference, Varsho is represented by ISE Baseball. -
Article: Is 2025 Daulton Varsho For Real?
Bob Ritchie replied to Jim Scott's topic in Jays Centre Front Page News
My sense is that Varsho largely tries to pull the ball with two strikes. I wonder if he would be a more effective hitter if he tried not to pull the pitch as much. During his career, with two strikes, his xwOBA is 0.236, and the league average is 0.233. -
Thank you. I am pleased that you enjoy the content.
-
.jpg.b4fdf1303f82917e739ad2a0d41a81a1.jpg) On May 10, Sportsnet's Ben Nicholson-Smith noted in a Bluesky post that Vladimir Guerrero Jr. has chased less in each of the past three seasons. I updated the data to May 18, and the 2025 trend continues. Let's take a closer look. Table 1 shows that since 2023, Guerrero Jr.'s Chase% has steadily decreased from the previous season each year. In 2022, his 30.5% Chase% exceeded his 2023 28.8% mark, which was higher than 2024's 27.5% Chase% and this season's 21.8%. For context, consider Guerrero Jr.'s Chase% percentile rankings (the lowest Chase% would be the 100th percentile) for the 2022-2025 period. His Chase% percentile ranking has increased consistently from 43rd in 2022 to 85th this season. Notably, Guerrero Jr.'s In-Zone Swing% has consistently declined since 2023. Regarding percentile rankings, his In-Zone Swing% has fallen from 90th to 20th. Unsurprisingly, Guerrero Jr.'s overall Swing% has also declined. His combined swing rate (Swing%) percentile ranking has dropped from 73rd in 2023 to 10th this campaign. Is Guerrero Jr. a more patient/passive batter in all situations than he was a few years ago? Let's turn to Table 2 and Table 3. For context, I present Table 2. As of May 18, Guerrero Jr. has 200 plate appearances. Concerning men on base ("MOB") and runners in scoring position (RISP) situations, he has fewer than 91 plate appearances. Hence, a small sample size warning. Nonetheless, some patterns in various situations have developed since 2022. Also, regarding Table 3, I highlighted numbers that exceeded the MLB average by three or more percentage points and situations where the MLB average surpassed Guerrero Jr.'s number by at least three percentage points. The three-percentage-point cutoff aligns with the approximately three percentage point difference between the 75th percentile Chase% and the median for the 2022-2024 period. Observation time! Chase% Concerning Chase%, Guerrero Jr. has chased at a lower rate with no men on base than the MLB average since 2023. This season, his 16.9 Chase% is considerably lower than the average. However, with men on base, Guerrero Jr. has been close to the average starting in 2022. Regarding RISP situations, his Chase Swing% consistently surpasses the MLB average. Notably, 2025 and 2023 are considerably higher than the average. Before 2025, with fewer than two strikes, Guerrero Jr.'s Chase Swing% exceeded each season's average. However, in 2025, his Chase% is almost five percentage points lower. This low Chase% is consistent with hitting coach David Popkins' batting approach, which I outlined in an earlier article. Guerrero Jr. has chased at a much lower rate with two strikes compared to the MLB average this and last season. In-Zone Swing% Suppose a passive hitter swings at in-zone pitches at a rate lower than the MLB average. Hence, an aggressive batter swings at in-zone pitches at a higher-than-average rate. Therefore, one description of 2025 Guerrero Jr. is that he is a passive batter in non-two-strike scenarios. Before 2024, he was an aggressive batter in all in-zone scenarios. In summary, 2025 Guerrero Jr. is chasing at a relatively low rate, whether in counts with fewer than two strikes or with two strikes. However, his Chase% continues to exceed the MLB average in RISP situations. Concerning In-Zone Swing%, the 2025 version of Guerrero Jr. is a passive batter. This latter observation is consistent with his Heart Zone Swing% with fewer than two strikes. In 2024, Guerrero Jr. swung at 52% of the Heart Zone pitches with fewer than two strikes. This season, his Swing% on these pitches is 38%. The 2025 number is a small sample (42 swings). However, Guerrero Jr. would have had to have swung at those pitches 57 times to achieve 2024's 52% mark, which is a lot more. Therefore, 2025 Guerrero Jr. is passive in counts with fewer than two strikes. From the Popkins' hitting philosophy perspective (slug in slug counts), we should expect lower chase rates. On this front, Guerrero Jr. is executing the noted philosophy thus far in 2025. However, concerning In-Zone Swing%, his rate in non-two-strike situations is below the MLB average. Furthermore, as of May 8, Guerrero Jr.'s Heart Zone Swing% was below the MLB median (I have not updated the data after my May 11 article). Hence, concerning In-Zone and Heart Zone Swing% data, Guerrero Jr. is not executing Popkins' philosophy. Let's move from Swing% to Contact%. Contact% Table 4 shows Contact% numbers in various situations. Concerning out-of-zone pitches, except for 2025 RISP situations, Guerrero Jr.'s Contact% was markedly higher than the MLB average in 2024 and has continued to be thus far in 2025. On in-zone pitches, his 2025 contact rates are close to the MLB average. An interesting 2025 development is Guerrero Jr.'s elevated K% from 2024's 13.8% mark. In 2025, his K% is 17.2% (the MLB average is 22.0%). Guerrero Jr.'s increased strikeout rate (2025 compared to 2024) is due to lower chase contact and in-zone contact rates with two strikes. Furthermore, as a percentage of all strikeouts, his called strikeout rate is higher (26% in 2025 compared to 21% last season). Notably, his 14.8% walk rate in 2025 is higher than 2024's 10.3% (the 2025 MLB average is 8.7%). The Last Word Guerrero Jr.'s 85th percentile ranking in Chase% shows that he chases at a very low rate. However, his In-Zone Swing% is 20th percentile (the highest Swing% is the 100th percentile). Given the low Chase% and In-Zone Swing%, one description of Guerrero Jr. is that he is a passive hitter, whether the pitch is in or out of the strike zone. Another explanation is that he is a disciplined batter on pitches out of the zone and passive regarding in-zone pitches. Furthermore, his relatively low Heart Zone Swing% with fewer than two strikes indicates passivity and not implementing an element of Popkins' hitting philosophy. We will have the rest of the 2025 season to determine the valid description.
On May 10, Sportsnet's Ben Nicholson-Smith noted in a Bluesky post that Vladimir Guerrero Jr. has chased less in each of the past three seasons. I updated the data to May 18, and the 2025 trend continues. Let's take a closer look. Table 1 shows that since 2023, Guerrero Jr.'s Chase% has steadily decreased from the previous season each year. In 2022, his 30.5% Chase% exceeded his 2023 28.8% mark, which was higher than 2024's 27.5% Chase% and this season's 21.8%. For context, consider Guerrero Jr.'s Chase% percentile rankings (the lowest Chase% would be the 100th percentile) for the 2022-2025 period. His Chase% percentile ranking has increased consistently from 43rd in 2022 to 85th this season. Notably, Guerrero Jr.'s In-Zone Swing% has consistently declined since 2023. Regarding percentile rankings, his In-Zone Swing% has fallen from 90th to 20th. Unsurprisingly, Guerrero Jr.'s overall Swing% has also declined. His combined swing rate (Swing%) percentile ranking has dropped from 73rd in 2023 to 10th this campaign. Is Guerrero Jr. a more patient/passive batter in all situations than he was a few years ago? Let's turn to Table 2 and Table 3. For context, I present Table 2. As of May 18, Guerrero Jr. has 200 plate appearances. Concerning men on base ("MOB") and runners in scoring position (RISP) situations, he has fewer than 91 plate appearances. Hence, a small sample size warning. Nonetheless, some patterns in various situations have developed since 2022. Also, regarding Table 3, I highlighted numbers that exceeded the MLB average by three or more percentage points and situations where the MLB average surpassed Guerrero Jr.'s number by at least three percentage points. The three-percentage-point cutoff aligns with the approximately three percentage point difference between the 75th percentile Chase% and the median for the 2022-2024 period. Observation time! Chase% Concerning Chase%, Guerrero Jr. has chased at a lower rate with no men on base than the MLB average since 2023. This season, his 16.9 Chase% is considerably lower than the average. However, with men on base, Guerrero Jr. has been close to the average starting in 2022. Regarding RISP situations, his Chase Swing% consistently surpasses the MLB average. Notably, 2025 and 2023 are considerably higher than the average. Before 2025, with fewer than two strikes, Guerrero Jr.'s Chase Swing% exceeded each season's average. However, in 2025, his Chase% is almost five percentage points lower. This low Chase% is consistent with hitting coach David Popkins' batting approach, which I outlined in an earlier article. Guerrero Jr. has chased at a much lower rate with two strikes compared to the MLB average this and last season. In-Zone Swing% Suppose a passive hitter swings at in-zone pitches at a rate lower than the MLB average. Hence, an aggressive batter swings at in-zone pitches at a higher-than-average rate. Therefore, one description of 2025 Guerrero Jr. is that he is a passive batter in non-two-strike scenarios. Before 2024, he was an aggressive batter in all in-zone scenarios. In summary, 2025 Guerrero Jr. is chasing at a relatively low rate, whether in counts with fewer than two strikes or with two strikes. However, his Chase% continues to exceed the MLB average in RISP situations. Concerning In-Zone Swing%, the 2025 version of Guerrero Jr. is a passive batter. This latter observation is consistent with his Heart Zone Swing% with fewer than two strikes. In 2024, Guerrero Jr. swung at 52% of the Heart Zone pitches with fewer than two strikes. This season, his Swing% on these pitches is 38%. The 2025 number is a small sample (42 swings). However, Guerrero Jr. would have had to have swung at those pitches 57 times to achieve 2024's 52% mark, which is a lot more. Therefore, 2025 Guerrero Jr. is passive in counts with fewer than two strikes. From the Popkins' hitting philosophy perspective (slug in slug counts), we should expect lower chase rates. On this front, Guerrero Jr. is executing the noted philosophy thus far in 2025. However, concerning In-Zone Swing%, his rate in non-two-strike situations is below the MLB average. Furthermore, as of May 8, Guerrero Jr.'s Heart Zone Swing% was below the MLB median (I have not updated the data after my May 11 article). Hence, concerning In-Zone and Heart Zone Swing% data, Guerrero Jr. is not executing Popkins' philosophy. Let's move from Swing% to Contact%. Contact% Table 4 shows Contact% numbers in various situations. Concerning out-of-zone pitches, except for 2025 RISP situations, Guerrero Jr.'s Contact% was markedly higher than the MLB average in 2024 and has continued to be thus far in 2025. On in-zone pitches, his 2025 contact rates are close to the MLB average. An interesting 2025 development is Guerrero Jr.'s elevated K% from 2024's 13.8% mark. In 2025, his K% is 17.2% (the MLB average is 22.0%). Guerrero Jr.'s increased strikeout rate (2025 compared to 2024) is due to lower chase contact and in-zone contact rates with two strikes. Furthermore, as a percentage of all strikeouts, his called strikeout rate is higher (26% in 2025 compared to 21% last season). Notably, his 14.8% walk rate in 2025 is higher than 2024's 10.3% (the 2025 MLB average is 8.7%). The Last Word Guerrero Jr.'s 85th percentile ranking in Chase% shows that he chases at a very low rate. However, his In-Zone Swing% is 20th percentile (the highest Swing% is the 100th percentile). Given the low Chase% and In-Zone Swing%, one description of Guerrero Jr. is that he is a passive hitter, whether the pitch is in or out of the strike zone. Another explanation is that he is a disciplined batter on pitches out of the zone and passive regarding in-zone pitches. Furthermore, his relatively low Heart Zone Swing% with fewer than two strikes indicates passivity and not implementing an element of Popkins' hitting philosophy. We will have the rest of the 2025 season to determine the valid description. -
On May 10, Sportsnet's Ben Nicholson-Smith noted in a Bluesky post that Vladimir Guerrero Jr. has chased less in each of the past three seasons. I updated the data to May 18, and the 2025 trend continues. Let's take a closer look. Table 1 shows that since 2023, Guerrero Jr.'s Chase% has steadily decreased from the previous season each year. In 2022, his 30.5% Chase% exceeded his 2023 28.8% mark, which was higher than 2024's 27.5% Chase% and this season's 21.8%. For context, consider Guerrero Jr.'s Chase% percentile rankings (the lowest Chase% would be the 100th percentile) for the 2022-2025 period. His Chase% percentile ranking has increased consistently from 43rd in 2022 to 85th this season. Notably, Guerrero Jr.'s In-Zone Swing% has consistently declined since 2023. Regarding percentile rankings, his In-Zone Swing% has fallen from 90th to 20th. Unsurprisingly, Guerrero Jr.'s overall Swing% has also declined. His combined swing rate (Swing%) percentile ranking has dropped from 73rd in 2023 to 10th this campaign. Is Guerrero Jr. a more patient/passive batter in all situations than he was a few years ago? Let's turn to Table 2 and Table 3. For context, I present Table 2. As of May 18, Guerrero Jr. has 200 plate appearances. Concerning men on base ("MOB") and runners in scoring position (RISP) situations, he has fewer than 91 plate appearances. Hence, a small sample size warning. Nonetheless, some patterns in various situations have developed since 2022. Also, regarding Table 3, I highlighted numbers that exceeded the MLB average by three or more percentage points and situations where the MLB average surpassed Guerrero Jr.'s number by at least three percentage points. The three-percentage-point cutoff aligns with the approximately three percentage point difference between the 75th percentile Chase% and the median for the 2022-2024 period. Observation time! Chase% Concerning Chase%, Guerrero Jr. has chased at a lower rate with no men on base than the MLB average since 2023. This season, his 16.9 Chase% is considerably lower than the average. However, with men on base, Guerrero Jr. has been close to the average starting in 2022. Regarding RISP situations, his Chase Swing% consistently surpasses the MLB average. Notably, 2025 and 2023 are considerably higher than the average. Before 2025, with fewer than two strikes, Guerrero Jr.'s Chase Swing% exceeded each season's average. However, in 2025, his Chase% is almost five percentage points lower. This low Chase% is consistent with hitting coach David Popkins' batting approach, which I outlined in an earlier article. Guerrero Jr. has chased at a much lower rate with two strikes compared to the MLB average this and last season. In-Zone Swing% Suppose a passive hitter swings at in-zone pitches at a rate lower than the MLB average. Hence, an aggressive batter swings at in-zone pitches at a higher-than-average rate. Therefore, one description of 2025 Guerrero Jr. is that he is a passive batter in non-two-strike scenarios. Before 2024, he was an aggressive batter in all in-zone scenarios. In summary, 2025 Guerrero Jr. is chasing at a relatively low rate, whether in counts with fewer than two strikes or with two strikes. However, his Chase% continues to exceed the MLB average in RISP situations. Concerning In-Zone Swing%, the 2025 version of Guerrero Jr. is a passive batter. This latter observation is consistent with his Heart Zone Swing% with fewer than two strikes. In 2024, Guerrero Jr. swung at 52% of the Heart Zone pitches with fewer than two strikes. This season, his Swing% on these pitches is 38%. The 2025 number is a small sample (42 swings). However, Guerrero Jr. would have had to have swung at those pitches 57 times to achieve 2024's 52% mark, which is a lot more. Therefore, 2025 Guerrero Jr. is passive in counts with fewer than two strikes. From the Popkins' hitting philosophy perspective (slug in slug counts), we should expect lower chase rates. On this front, Guerrero Jr. is executing the noted philosophy thus far in 2025. However, concerning In-Zone Swing%, his rate in non-two-strike situations is below the MLB average. Furthermore, as of May 8, Guerrero Jr.'s Heart Zone Swing% was below the MLB median (I have not updated the data after my May 11 article). Hence, concerning In-Zone and Heart Zone Swing% data, Guerrero Jr. is not executing Popkins' philosophy. Let's move from Swing% to Contact%. Contact% Table 4 shows Contact% numbers in various situations. Concerning out-of-zone pitches, except for 2025 RISP situations, Guerrero Jr.'s Contact% was markedly higher than the MLB average in 2024 and has continued to be thus far in 2025. On in-zone pitches, his 2025 contact rates are close to the MLB average. An interesting 2025 development is Guerrero Jr.'s elevated K% from 2024's 13.8% mark. In 2025, his K% is 17.2% (the MLB average is 22.0%). Guerrero Jr.'s increased strikeout rate (2025 compared to 2024) is due to lower chase contact and in-zone contact rates with two strikes. Furthermore, as a percentage of all strikeouts, his called strikeout rate is higher (26% in 2025 compared to 21% last season). Notably, his 14.8% walk rate in 2025 is higher than 2024's 10.3% (the 2025 MLB average is 8.7%). The Last Word Guerrero Jr.'s 85th percentile ranking in Chase% shows that he chases at a very low rate. However, his In-Zone Swing% is 20th percentile (the highest Swing% is the 100th percentile). Given the low Chase% and In-Zone Swing%, one description of Guerrero Jr. is that he is a passive hitter, whether the pitch is in or out of the strike zone. Another explanation is that he is a disciplined batter on pitches out of the zone and passive regarding in-zone pitches. Furthermore, his relatively low Heart Zone Swing% with fewer than two strikes indicates passivity and not implementing an element of Popkins' hitting philosophy. We will have the rest of the 2025 season to determine the valid description. View full article
-
Article: Celebrating Vladdy’s 500th Run Scored
Bob Ritchie replied to Mike LeSage's topic in Jays Centre Front Page News
If I were to make a guess, a lot of data-retrieval work would go into this article. It was a fun read. Well done! -
Article: Blue Jay Batter Barrel Blues
Bob Ritchie replied to Bob Ritchie's topic in Jays Centre Front Page News
For sure, Barger and Varsho. Also, Bo, Vlad, Kirk, Lukes, and Springer had notably better numbers. After April 27, there were also fewer PAs from Roden and Wagner, who were well below the median. -
 On April 28, on Bluesky, MLB.com’s Mike Petriello noted that Toronto’s batters posted the second-lowest Barrel% in 2025. Although Toronto's ranking has since improved to 20th, should the Blue Jays be concerned? Can the team improve their Barrel% performance for the rest of the season? Let’s dig into the topic. According to MLB.com, “The Barrel classification is assigned to batted-ball events whose comparable hit types (in terms of exit velocity and launch angle) have led to a minimum .500 batting average and 1.500 slugging percentage since Statcast was implemented Major League wide in 2015.” Previously, I wrote about the strong, positive correlation (0.84 R-Squared) between slugging percentage and runs. As of May 9, the Blue Jays rank 24th in runs per game with their 3.71 mark, lower than MLB’s 4.35 average. Toronto’s 0.362 SLG slots in at #25, bested by MLB’s 0.391. The correlation between runs and various Barrel metrics (Barrels, Barre%, or Barrels/PA%) is positive, but not strong. The highest R-squared is 0.30. Surprisingly, the relationship between SLG and the noted Barrel metrics is positive, but weak. However, all is not lost. Although the noted Barrel metrics have less predictive value than SLG vis-à-vis runs, Barrel metrics can help examine what has happened thus far in 2025. Shout-out to my friend Lorne, a member of the Actuarial Pantheon, with whom I always consult on statistical matters. Let’s examine Barrel and SLG metrics. Why are the Blue Jays lagging in the Barrel department? I identified two noteworthy reasons: Failure to fully implement one of Toronto’s hitting philosophies Roster construction Failure to Implement One of Toronto’s Hitting Philosophies During spring training, David Popkins, Blue Jays’ new Hitting Coach, described one of Toronto’s hitting philosophies. "Our goal is to slug in slugging counts and be a little more on-base/execution in counts that don't yield slug." I interpret that comment to mean the following: With less than two strikes, Toronto hitters will attack pitches they can barrel up. Otherwise, the batters will not swing at the pitch. With two strikes, the batter sacrifices power to increase contact probability or take a walk. For this analysis, I will not examine situational hitting. A good way to determine if Toronto is applying the noted philosophy is to consider two elements. First, what have Toronto’s hitters done when there are fewer than two strikes, and when there are two strikes? With less than two strikes, a batter can wait for their pitch and barrel the ball. With two strikes, a batter will be in survival mode and focus more on contact than power. The second element is the location of pitches. Instead of examining whether a pitch is in the strike zone, I prefer to look at the attack zones: Heart, Shadow, Chase, and Waste. The chart below depicts the attack zones, courtesy of FanGraphs. I use xSLG rather than SLG for this analysis for two reasons. First, the inputs for xSLG are exit velocity and launch angle. Hence, the impact of defence is not a factor in the result. Second, exit velocity and launch angle are the factors that comprise Barrels, which is a focus of this article. For context, in 2024, MLB’s average SLG was 0.399; the xSLG average was 0.397. Also, I combined the Chase and Waste zones. My rationale is twofold. First, the swing rate on pitches in the Waste Zone was less than six percent. Second, the xSLG on pitches in the Waste Zone was 0.014, and the Barrels are zero. In other words, the impact of standalone Waste Zone metrics is insignificant to the overall analysis. In 2024, the Chase/Waste Zones accounted for 27% of pitches. The Heart Zone shares 29%, and the Shadow Zone 44%. Onto the Blue Jays’ approach. Let’s set a high-performance bar. If Toronto has executed the stated approach well, it should rank in the top five of a given metric. Accordingly, we should expect Blue Jay hitters to do the following: With less than two strikes, there is a top-five or higher Swing% on pitches in the Heart Zone. The inner part of the Shadow Zone is in the strike zone, and the outer part is not. Hence, with less than two strikes, a batter should not swing at pitches in the Shadow Zone. With two strikes, any pitch in the Shadow Zone is either a strike or too close to take. Hence, with less than two strikes, the Swing% should be lower (ranked highest to lowest) than the 25th team in the Shadow Zone and the combined Chase and Waste Zones. Because Toronto is willing to sacrifice power in two-strike counts, Toronto’s batters should have a contact rate on pitches in the Heart, Shadow, and Chase/Waste zones that is at least the fifth-highest. Toronto should have a K% in plate appearances that reach two strikes no higher than 26th among teams (fifth-lowest). For reference, approximately 53% of plate appearances end up in a two-strike count. As of May 8, what has happened? Table 1 has the details. Spoiler Alert: The Blue Jays are not executing Popkins’s philosophy. With less than two strikes, Toronto ranks poorly on Heart Zone Swing% while their Swing% in the other zones is too high. Concerning the Heart and Shadow Zones, Toronto’s numbers are consistent with Popkins’s approach when there are two strikes. The Swing% rates are in the top five in the respective zones. However, the Blue Jays’ relatively high Chase & Waste swing rate is inconsistent with Popkins’s philosophy. Toronto’s Contact% numbers in non-Heart Zones are within the top seven in all counts. Yet, Blue Jay batters have failed to meet the top-five standard in Contact% on pitches in the Heart, particularly with two strikes. Toronto has below-median xSLG and Barrel% numbers on Heart Zone pitches. On the positive side, when Blue Jay hitters are in two-strike counts, their 37.8 K% mark ranks third-lowest. This result is consistent with Popkins’s focus on contact with two strikes. In summary, in counts with less than two strikes, Toronto batters swing at pitches in the Heart, Zone, and slug/barrel, at below-desired rates. With two strikes, Toronto’s xSLG metrics are better than the median in all zones. In all counts, Blue Jay hitters’ chase rates are too high. Roster Construction In theory, with fewer than two strikes, Toronto batters should be able to produce higher SLG numbers if they increased their Swing% on pitches in the Heart Zone, and reduced their Swing% in the other zones. However, roster construction limits their SLG/xSLG and barrel ceilings. In other words, there is not enough SLG or barrel potential on the roster. Consider Table 2, Table 3, and Table 4. Table 2 shows 2022-2024 metrics of Blue Jay hitters with plate appearances over 100 this season, plus Daulton Varsho. Except for Varsho, Table 3 depicts the xSLG and Barrel% for the 2025 season for the listed Blue Jays. Table 4 shows the differences between 2025 and 2022-2024 for each metric for the players listed. Table 3 shows a lot of green (below median performance) regarding xSLG and Barrel%, particularly in the Heart Zone, where xSLG and barrels are at their highest. I used Table 4’s xSLG and Barrel% data as a thought exercise and weighted each player’s numbers by ZiPS DC Rest of Season at-bats. The results are as follows: xSLG for the balance of this season will change little from the Opening Day through May 8 record. Barrel% will decline marginally. Therefore, better xSLG/SLG, and accordingly, run production, would likely occur if one or more of the following happened: Blue Jay batters execute Popkins’s philosophy. Currently, Toronto has the fourth-largest xSLG-SLG difference (0.408 versus 0.362). Suppose xSLG, which ranks 19th, holds steady. An SLG regression towards the xSLG number could result in a run-production bump. Toronto gives more at-bats to the Blue Jays, with higher xSLG numbers. For example, Addison Barger’s 2025 0.466 xSLG is higher than Ernie Clement’s 0.327. Sign a free agent such as J.D. Martinez, who produced a 0.472 xSLG in 2024. I should note that 2025 would be Martinez’s age-37 season. Also, he is strictly a designated hitter, which means more outfield time for defence-challenged Anthony Santander (career -14 OAA and -19 FRV as an outfielder). The Last Word Toronto’s below-median Barrel metrics are consistent with their relatively poor xSLG/SLG and run production numbers. The reasons for the underperformance are twofold. First, contrary to the stated approach to hitting, Toronto does not slug in slugging counts nor barrel the ball. Second, the everyday roster does not profile as a team that slugs or barrels. If Toronto can execute their hitting philosophy better, change the regular lineup, and toss in a little positive regression, the ballclub can alleviate their batter barrel blues.
 -
On April 28, on Bluesky, MLB.com’s Mike Petriello noted that Toronto’s batters posted the second-lowest Barrel% in 2025. Although Toronto's ranking has since improved to 20th, should the Blue Jays be concerned? Can the team improve their Barrel% performance for the rest of the season? Let’s dig into the topic. According to MLB.com, “The Barrel classification is assigned to batted-ball events whose comparable hit types (in terms of exit velocity and launch angle) have led to a minimum .500 batting average and 1.500 slugging percentage since Statcast was implemented Major League wide in 2015.” Previously, I wrote about the strong, positive correlation (0.84 R-Squared) between slugging percentage and runs. As of May 9, the Blue Jays rank 24th in runs per game with their 3.71 mark, lower than MLB’s 4.35 average. Toronto’s 0.362 SLG slots in at #25, bested by MLB’s 0.391. The correlation between runs and various Barrel metrics (Barrels, Barre%, or Barrels/PA%) is positive, but not strong. The highest R-squared is 0.30. Surprisingly, the relationship between SLG and the noted Barrel metrics is positive, but weak. However, all is not lost. Although the noted Barrel metrics have less predictive value than SLG vis-à-vis runs, Barrel metrics can help examine what has happened thus far in 2025. Shout-out to my friend Lorne, a member of the Actuarial Pantheon, with whom I always consult on statistical matters. Let’s examine Barrel and SLG metrics. Why are the Blue Jays lagging in the Barrel department? I identified two noteworthy reasons: Failure to fully implement one of Toronto’s hitting philosophies Roster construction Failure to Implement One of Toronto’s Hitting Philosophies During spring training, David Popkins, Blue Jays’ new Hitting Coach, described one of Toronto’s hitting philosophies. "Our goal is to slug in slugging counts and be a little more on-base/execution in counts that don't yield slug." I interpret that comment to mean the following: With less than two strikes, Toronto hitters will attack pitches they can barrel up. Otherwise, the batters will not swing at the pitch. With two strikes, the batter sacrifices power to increase contact probability or take a walk. For this analysis, I will not examine situational hitting. A good way to determine if Toronto is applying the noted philosophy is to consider two elements. First, what have Toronto’s hitters done when there are fewer than two strikes, and when there are two strikes? With less than two strikes, a batter can wait for their pitch and barrel the ball. With two strikes, a batter will be in survival mode and focus more on contact than power. The second element is the location of pitches. Instead of examining whether a pitch is in the strike zone, I prefer to look at the attack zones: Heart, Shadow, Chase, and Waste. The chart below depicts the attack zones, courtesy of FanGraphs. I use xSLG rather than SLG for this analysis for two reasons. First, the inputs for xSLG are exit velocity and launch angle. Hence, the impact of defence is not a factor in the result. Second, exit velocity and launch angle are the factors that comprise Barrels, which is a focus of this article. For context, in 2024, MLB’s average SLG was 0.399; the xSLG average was 0.397. Also, I combined the Chase and Waste zones. My rationale is twofold. First, the swing rate on pitches in the Waste Zone was less than six percent. Second, the xSLG on pitches in the Waste Zone was 0.014, and the Barrels are zero. In other words, the impact of standalone Waste Zone metrics is insignificant to the overall analysis. In 2024, the Chase/Waste Zones accounted for 27% of pitches. The Heart Zone shares 29%, and the Shadow Zone 44%. Onto the Blue Jays’ approach. Let’s set a high-performance bar. If Toronto has executed the stated approach well, it should rank in the top five of a given metric. Accordingly, we should expect Blue Jay hitters to do the following: With less than two strikes, there is a top-five or higher Swing% on pitches in the Heart Zone. The inner part of the Shadow Zone is in the strike zone, and the outer part is not. Hence, with less than two strikes, a batter should not swing at pitches in the Shadow Zone. With two strikes, any pitch in the Shadow Zone is either a strike or too close to take. Hence, with less than two strikes, the Swing% should be lower (ranked highest to lowest) than the 25th team in the Shadow Zone and the combined Chase and Waste Zones. Because Toronto is willing to sacrifice power in two-strike counts, Toronto’s batters should have a contact rate on pitches in the Heart, Shadow, and Chase/Waste zones that is at least the fifth-highest. Toronto should have a K% in plate appearances that reach two strikes no higher than 26th among teams (fifth-lowest). For reference, approximately 53% of plate appearances end up in a two-strike count. As of May 8, what has happened? Table 1 has the details. Spoiler Alert: The Blue Jays are not executing Popkins’s philosophy. With less than two strikes, Toronto ranks poorly on Heart Zone Swing% while their Swing% in the other zones is too high. Concerning the Heart and Shadow Zones, Toronto’s numbers are consistent with Popkins’s approach when there are two strikes. The Swing% rates are in the top five in the respective zones. However, the Blue Jays’ relatively high Chase & Waste swing rate is inconsistent with Popkins’s philosophy. Toronto’s Contact% numbers in non-Heart Zones are within the top seven in all counts. Yet, Blue Jay batters have failed to meet the top-five standard in Contact% on pitches in the Heart, particularly with two strikes. Toronto has below-median xSLG and Barrel% numbers on Heart Zone pitches. On the positive side, when Blue Jay hitters are in two-strike counts, their 37.8 K% mark ranks third-lowest. This result is consistent with Popkins’s focus on contact with two strikes. In summary, in counts with less than two strikes, Toronto batters swing at pitches in the Heart, Zone, and slug/barrel, at below-desired rates. With two strikes, Toronto’s xSLG metrics are better than the median in all zones. In all counts, Blue Jay hitters’ chase rates are too high. Roster Construction In theory, with fewer than two strikes, Toronto batters should be able to produce higher SLG numbers if they increased their Swing% on pitches in the Heart Zone, and reduced their Swing% in the other zones. However, roster construction limits their SLG/xSLG and barrel ceilings. In other words, there is not enough SLG or barrel potential on the roster. Consider Table 2, Table 3, and Table 4. Table 2 shows 2022-2024 metrics of Blue Jay hitters with plate appearances over 100 this season, plus Daulton Varsho. Except for Varsho, Table 3 depicts the xSLG and Barrel% for the 2025 season for the listed Blue Jays. Table 4 shows the differences between 2025 and 2022-2024 for each metric for the players listed. Table 3 shows a lot of green (below median performance) regarding xSLG and Barrel%, particularly in the Heart Zone, where xSLG and barrels are at their highest. I used Table 4’s xSLG and Barrel% data as a thought exercise and weighted each player’s numbers by ZiPS DC Rest of Season at-bats. The results are as follows: xSLG for the balance of this season will change little from the Opening Day through May 8 record. Barrel% will decline marginally. Therefore, better xSLG/SLG, and accordingly, run production, would likely occur if one or more of the following happened: Blue Jay batters execute Popkins’s philosophy. Currently, Toronto has the fourth-largest xSLG-SLG difference (0.408 versus 0.362). Suppose xSLG, which ranks 19th, holds steady. An SLG regression towards the xSLG number could result in a run-production bump. Toronto gives more at-bats to the Blue Jays, with higher xSLG numbers. For example, Addison Barger’s 2025 0.466 xSLG is higher than Ernie Clement’s 0.327. Sign a free agent such as J.D. Martinez, who produced a 0.472 xSLG in 2024. I should note that 2025 would be Martinez’s age-37 season. Also, he is strictly a designated hitter, which means more outfield time for defence-challenged Anthony Santander (career -14 OAA and -19 FRV as an outfielder). The Last Word Toronto’s below-median Barrel metrics are consistent with their relatively poor xSLG/SLG and run production numbers. The reasons for the underperformance are twofold. First, contrary to the stated approach to hitting, Toronto does not slug in slugging counts nor barrel the ball. Second, the everyday roster does not profile as a team that slugs or barrels. If Toronto can execute their hitting philosophy better, change the regular lineup, and toss in a little positive regression, the ballclub can alleviate their batter barrel blues. View full article
-
.jpg.fa845c3bbdb1f29f32638aa88cd3744d.jpg) On April 14, the Toronto Blue Jays held a media event to officially announce their 14-year, $500 million contract extension with Vladimir Guerrero Jr. Soon after, media and fan attention turned to another extension candidate, Bo Bichette. So, let's take a deep dive into the factors involved in a potential Bichette extension. Contract Model Like many people, I use an fWAR-based model to estimate contract values. I project performance (fWAR) for a given term and apply a dollar value per fWAR to the projected performance. The critical assumptions are as follows: Age has an impact on performance. Accordingly, based on averages, for ages before 28, fWAR increases by 0.25 per season, and remains the same in the 28-30 age range. Between ages 31 & 37, fWAR is 0.5 lower each season, and 0.75 lower annually after age 37. If a player changes positions during the term of the contract, I may need to adjust fWAR. See FanGraphs for further analysis. The dollars per fWAR is not a linear relationship. Accordingly, I reduce $/fWAR by 20% when a season's fWAR is 2.0 or less. Given that $/fWAR tends to increase over time, I inflate the previous season's $/fWAR by 3%. Will Bichette Play Shortstop? The best defensive middle infield regular on the 2025 Blue Jays is Andrés Giménez, not Bichette. Check out Table 1, Table 2, and Table 3. Before 2024, Bichette's FRV and OAA ranked in the bottom third of all shortstops. Because of injuries, Bichette played just 684 innings at short in 2024, less than the 1,261 innings he averaged in 2021-2023. Accordingly, I put less weight on his FRV and OAA rankings in 2024 due to the small sample size. However, Giménez's 2022-2024 FRV and OAA rankings among second basemen are elite. So, why would Giménez be a better shortstop than Bichette? First, during his career at short, Giménez has posted 8 OAA in 304 attempts, corresponding with 11 OAA/400. In 2024, an 11 OAA would have ranked T7 among shortstops. Second, the lateral movement components of Giménez's OAA are superior to Bichette's. Third, foot speed over short distances is crucial for playing shortstop effectively. Table 3 shows that Giménez's percentile rankings over five-foot increments, from five to thirty feet, are significantly better than Bichette's. In my opinion, Giménez's superior footspeed over short distances lends itself to better shortstop performance. From an arm strength perspective, consider Table 4. Regarding maximum velocity, both Giménez and Bichette have the arm strength to play shortstop. Additionally, both players possess the arm strength to play third base; the average arm strength of third basemen was 85.7 mph in 2024. If I were to offer a contract extension to Bichette, I would condition the offer on his acceptance that he will move to second, or possibly third base. Accordingly, a position change from shortstop would reduce his positional adjustment from 7.5 runs (shortstop) to 2.5 runs (second or third base). Based on 2024's 9.683 runs per win factor, the five-run reduction corresponds to an approximate 0.5 fWAR decrease. However, if Bichette played better defence at second/third than he does at shortstop, the 0.5 positional fWAR decrease could be mitigated by a higher fielding run number. For estimating a contract extension, I will assume that Bichette's fielding run number will not increase by switching from shortstop because his lateral movement projects to be average, at best. The Impact of Bichette's 2024 Season From 2021 to 2023, Bichette averaged 4.5 fWAR per season. In 2024, Bichette posted a 0.3 fWAR in 81 games. Most projections place Bichette's 2025 season in the 3.5 to 3.8 fWAR range. Also, during his career, Bichette is an average baserunner (+1 Baserunning Runs), and his defence is average, at best. Accordingly, Bichette's value-added depends on his bat. He is a career 119 wRC+ batter, which is very good but not great. Given the potential position change and other noted factors, a 2026 4.0 fWAR projection is reasonable. The Impact of the Guerrero Jr. and Juan Soto Contracts It is challenging for teams, players, and MLB observers to estimate the current dollar value per fWAR figure. For a Bichette contract estimate, I need to determine the $/fWAR number for the 2026 season. Here is my attempt. In December 2022, Aaron Judge signed a nine-year, $360 million contract with the New York Yankees. Based on Steamer's 2023 6.9 fWAR estimate, according to my model, the implied 2023 $/fWAR was $8.8 million and $9.4 million for the 2025 season. When the most recent free agent period began, MLB Trade Rumors's estimate for a Juan Soto contract was a 13-year, $600 million deal. Given Steamer's 2025 Soto 6.0 fWAR projection, the implied 2025 $/fWAR was $9.4 million. The $9.4 million figure was the implied rate for MLBTR's Willy Adames's six-year, $160 million contract estimate. Adames signed a seven-year, $182 million deal, corresponding to $10.1 million per fWAR in 2025. That is close to MLBTR's and Judge's 2025 implied $9.4 million. So, does the implied 2025 $10.1 million per fWAR work for the Guerrero Jr. and Soto contracts? No, not even close. Please refer to Table 5. Ultimately, Soto signed a 15-year, $765 million deal. After adjusting for the additional two years and the higher $/fWAR ($10.1 million versus $9.4 million), I arrived at a 15-year, $640 million deal. The implied premium paid by the Mets to land Soto was $125 million ($765 million less $640 million). The premium is understandable. First, suppose the $125 million is paid evenly over 15 years. With a 5% discount rate, the present value of the premium is approximately $86 million, not as astounding as the $125 million sticker price. Second, the bidders included the Mets and the Yankees. Accordingly, a bidding war between teams with deep pockets was likely to push the $/fWAR upwards. According to my model, Toronto paid a $96 million premium to sign Guerrero Jr. to an extension. The Blue Jays were probably willing to pay more than the market $/fWAR for multiple reasons, including their preference to field a competitive team beyond 2025, maintaining or increasing revenues with Guerrero Jr. to cover the Rogers Centre's renovation costs, and other considerations. I acknowledge that the estimated Soto and Guerrero Jr. premiums are projections, not known prices. For example, New York's projected fWAR for Soto could be higher than mine, which would reduce the premium. However, because MLBTR has a good record regarding contract estimates, there were probably abnormal factors that caused Soto's deal to exceed expectations. Also, it is unusual for Year 1 $/fWAR to change significantly from one year to the next. According to my calculation, the $/fWAR increased from $9.4 million to $12.0 million for Soto. Lastly, Soto's $12.0 million $/fWAR is substantially higher than Adames's $10.1 million. These points suggest that the Mets and Blue Jays paid premiums, perhaps not as large as $125 million and $96 million, to secure the players. The special circumstances that led the Mets and Blue Jays to pay significant premiums to Soto and Guerrero Jr. will not apply to Bichette. He is not as valuable to Toronto as Guerrero Jr. Accordingly, I used $10.4 million/fWAR (2025's $ 10.1 million, increased by 3%) for Bichette's contract estimate. Contract Estimates Table 6 shows multiple contract estimates. The variables for the projections are contract length (eight or ten years) and first-year fWAR (4.5, 4.0 or 3.5). Because a starting 4.0 fWAR is reasonable, a 10-year, $283.4 million deal or an eight-year, $267.5 million agreement would be sensible. The tenth year of the contract would be Bichette's age-37 season. The present value of the 10-year deal is slightly higher than that of the eight-year contract. One advantage of the 10-year agreement is that the lower AAV ($28.3 million versus $33.4 million) would result in a lower competitive balance tax number. Will Bichette accept my reasonable contract? I have no idea, but it's fun to speculate. The Last Word Bichette is an average-ish fielder and baserunner. However, he is a very good hitter, which, given Toronto's need to bolster its offence, is worth retaining beyond 2025. Furthermore, the Blue Jays seem to have decided to compete for multiple postseason berths after 2025. The Guerrero Jr. extension is consistent with that goal, as would signing Bichette to a new, but reasonable, contract.
On April 14, the Toronto Blue Jays held a media event to officially announce their 14-year, $500 million contract extension with Vladimir Guerrero Jr. Soon after, media and fan attention turned to another extension candidate, Bo Bichette. So, let's take a deep dive into the factors involved in a potential Bichette extension. Contract Model Like many people, I use an fWAR-based model to estimate contract values. I project performance (fWAR) for a given term and apply a dollar value per fWAR to the projected performance. The critical assumptions are as follows: Age has an impact on performance. Accordingly, based on averages, for ages before 28, fWAR increases by 0.25 per season, and remains the same in the 28-30 age range. Between ages 31 & 37, fWAR is 0.5 lower each season, and 0.75 lower annually after age 37. If a player changes positions during the term of the contract, I may need to adjust fWAR. See FanGraphs for further analysis. The dollars per fWAR is not a linear relationship. Accordingly, I reduce $/fWAR by 20% when a season's fWAR is 2.0 or less. Given that $/fWAR tends to increase over time, I inflate the previous season's $/fWAR by 3%. Will Bichette Play Shortstop? The best defensive middle infield regular on the 2025 Blue Jays is Andrés Giménez, not Bichette. Check out Table 1, Table 2, and Table 3. Before 2024, Bichette's FRV and OAA ranked in the bottom third of all shortstops. Because of injuries, Bichette played just 684 innings at short in 2024, less than the 1,261 innings he averaged in 2021-2023. Accordingly, I put less weight on his FRV and OAA rankings in 2024 due to the small sample size. However, Giménez's 2022-2024 FRV and OAA rankings among second basemen are elite. So, why would Giménez be a better shortstop than Bichette? First, during his career at short, Giménez has posted 8 OAA in 304 attempts, corresponding with 11 OAA/400. In 2024, an 11 OAA would have ranked T7 among shortstops. Second, the lateral movement components of Giménez's OAA are superior to Bichette's. Third, foot speed over short distances is crucial for playing shortstop effectively. Table 3 shows that Giménez's percentile rankings over five-foot increments, from five to thirty feet, are significantly better than Bichette's. In my opinion, Giménez's superior footspeed over short distances lends itself to better shortstop performance. From an arm strength perspective, consider Table 4. Regarding maximum velocity, both Giménez and Bichette have the arm strength to play shortstop. Additionally, both players possess the arm strength to play third base; the average arm strength of third basemen was 85.7 mph in 2024. If I were to offer a contract extension to Bichette, I would condition the offer on his acceptance that he will move to second, or possibly third base. Accordingly, a position change from shortstop would reduce his positional adjustment from 7.5 runs (shortstop) to 2.5 runs (second or third base). Based on 2024's 9.683 runs per win factor, the five-run reduction corresponds to an approximate 0.5 fWAR decrease. However, if Bichette played better defence at second/third than he does at shortstop, the 0.5 positional fWAR decrease could be mitigated by a higher fielding run number. For estimating a contract extension, I will assume that Bichette's fielding run number will not increase by switching from shortstop because his lateral movement projects to be average, at best. The Impact of Bichette's 2024 Season From 2021 to 2023, Bichette averaged 4.5 fWAR per season. In 2024, Bichette posted a 0.3 fWAR in 81 games. Most projections place Bichette's 2025 season in the 3.5 to 3.8 fWAR range. Also, during his career, Bichette is an average baserunner (+1 Baserunning Runs), and his defence is average, at best. Accordingly, Bichette's value-added depends on his bat. He is a career 119 wRC+ batter, which is very good but not great. Given the potential position change and other noted factors, a 2026 4.0 fWAR projection is reasonable. The Impact of the Guerrero Jr. and Juan Soto Contracts It is challenging for teams, players, and MLB observers to estimate the current dollar value per fWAR figure. For a Bichette contract estimate, I need to determine the $/fWAR number for the 2026 season. Here is my attempt. In December 2022, Aaron Judge signed a nine-year, $360 million contract with the New York Yankees. Based on Steamer's 2023 6.9 fWAR estimate, according to my model, the implied 2023 $/fWAR was $8.8 million and $9.4 million for the 2025 season. When the most recent free agent period began, MLB Trade Rumors's estimate for a Juan Soto contract was a 13-year, $600 million deal. Given Steamer's 2025 Soto 6.0 fWAR projection, the implied 2025 $/fWAR was $9.4 million. The $9.4 million figure was the implied rate for MLBTR's Willy Adames's six-year, $160 million contract estimate. Adames signed a seven-year, $182 million deal, corresponding to $10.1 million per fWAR in 2025. That is close to MLBTR's and Judge's 2025 implied $9.4 million. So, does the implied 2025 $10.1 million per fWAR work for the Guerrero Jr. and Soto contracts? No, not even close. Please refer to Table 5. Ultimately, Soto signed a 15-year, $765 million deal. After adjusting for the additional two years and the higher $/fWAR ($10.1 million versus $9.4 million), I arrived at a 15-year, $640 million deal. The implied premium paid by the Mets to land Soto was $125 million ($765 million less $640 million). The premium is understandable. First, suppose the $125 million is paid evenly over 15 years. With a 5% discount rate, the present value of the premium is approximately $86 million, not as astounding as the $125 million sticker price. Second, the bidders included the Mets and the Yankees. Accordingly, a bidding war between teams with deep pockets was likely to push the $/fWAR upwards. According to my model, Toronto paid a $96 million premium to sign Guerrero Jr. to an extension. The Blue Jays were probably willing to pay more than the market $/fWAR for multiple reasons, including their preference to field a competitive team beyond 2025, maintaining or increasing revenues with Guerrero Jr. to cover the Rogers Centre's renovation costs, and other considerations. I acknowledge that the estimated Soto and Guerrero Jr. premiums are projections, not known prices. For example, New York's projected fWAR for Soto could be higher than mine, which would reduce the premium. However, because MLBTR has a good record regarding contract estimates, there were probably abnormal factors that caused Soto's deal to exceed expectations. Also, it is unusual for Year 1 $/fWAR to change significantly from one year to the next. According to my calculation, the $/fWAR increased from $9.4 million to $12.0 million for Soto. Lastly, Soto's $12.0 million $/fWAR is substantially higher than Adames's $10.1 million. These points suggest that the Mets and Blue Jays paid premiums, perhaps not as large as $125 million and $96 million, to secure the players. The special circumstances that led the Mets and Blue Jays to pay significant premiums to Soto and Guerrero Jr. will not apply to Bichette. He is not as valuable to Toronto as Guerrero Jr. Accordingly, I used $10.4 million/fWAR (2025's $ 10.1 million, increased by 3%) for Bichette's contract estimate. Contract Estimates Table 6 shows multiple contract estimates. The variables for the projections are contract length (eight or ten years) and first-year fWAR (4.5, 4.0 or 3.5). Because a starting 4.0 fWAR is reasonable, a 10-year, $283.4 million deal or an eight-year, $267.5 million agreement would be sensible. The tenth year of the contract would be Bichette's age-37 season. The present value of the 10-year deal is slightly higher than that of the eight-year contract. One advantage of the 10-year agreement is that the lower AAV ($28.3 million versus $33.4 million) would result in a lower competitive balance tax number. Will Bichette accept my reasonable contract? I have no idea, but it's fun to speculate. The Last Word Bichette is an average-ish fielder and baserunner. However, he is a very good hitter, which, given Toronto's need to bolster its offence, is worth retaining beyond 2025. Furthermore, the Blue Jays seem to have decided to compete for multiple postseason berths after 2025. The Guerrero Jr. extension is consistent with that goal, as would signing Bichette to a new, but reasonable, contract. -
Now that the Blue Jays and Vladimir Guerrero Jr. have agreed to a contract extension, what might it take to keep Bo Bichette in town beyond 2025? On April 14, the Toronto Blue Jays held a media event to officially announce their 14-year, $500 million contract extension with Vladimir Guerrero Jr. Soon after, media and fan attention turned to another extension candidate, Bo Bichette. So, let's take a deep dive into the factors involved in a potential Bichette extension. Contract Model Like many people, I use an fWAR-based model to estimate contract values. I project performance (fWAR) for a given term and apply a dollar value per fWAR to the projected performance. The critical assumptions are as follows: Age has an impact on performance. Accordingly, based on averages, for ages before 28, fWAR increases by 0.25 per season, and remains the same in the 28-30 age range. Between ages 31 & 37, fWAR is 0.5 lower each season, and 0.75 lower annually after age 37. If a player changes positions during the term of the contract, I may need to adjust fWAR. See FanGraphs for further analysis. The dollars per fWAR is not a linear relationship. Accordingly, I reduce $/fWAR by 20% when a season's fWAR is 2.0 or less. Given that $/fWAR tends to increase over time, I inflate the previous season's $/fWAR by 3%. Will Bichette Play Shortstop? The best defensive middle infield regular on the 2025 Blue Jays is Andrés Giménez, not Bichette. Check out Table 1, Table 2, and Table 3. Before 2024, Bichette's FRV and OAA ranked in the bottom third of all shortstops. Because of injuries, Bichette played just 684 innings at short in 2024, less than the 1,261 innings he averaged in 2021-2023. Accordingly, I put less weight on his FRV and OAA rankings in 2024 due to the small sample size. However, Giménez's 2022-2024 FRV and OAA rankings among second basemen are elite. So, why would Giménez be a better shortstop than Bichette? First, during his career at short, Giménez has posted 8 OAA in 304 attempts, corresponding with 11 OAA/400. In 2024, an 11 OAA would have ranked T7 among shortstops. Second, the lateral movement components of Giménez's OAA are superior to Bichette's. Third, foot speed over short distances is crucial for playing shortstop effectively. Table 3 shows that Giménez's percentile rankings over five-foot increments, from five to thirty feet, are significantly better than Bichette's. In my opinion, Giménez's superior footspeed over short distances lends itself to better shortstop performance. From an arm strength perspective, consider Table 4. Regarding maximum velocity, both Giménez and Bichette have the arm strength to play shortstop. Additionally, both players possess the arm strength to play third base; the average arm strength of third basemen was 85.7 mph in 2024. If I were to offer a contract extension to Bichette, I would condition the offer on his acceptance that he will move to second, or possibly third base. Accordingly, a position change from shortstop would reduce his positional adjustment from 7.5 runs (shortstop) to 2.5 runs (second or third base). Based on 2024's 9.683 runs per win factor, the five-run reduction corresponds to an approximate 0.5 fWAR decrease. However, if Bichette played better defence at second/third than he does at shortstop, the 0.5 positional fWAR decrease could be mitigated by a higher fielding run number. For estimating a contract extension, I will assume that Bichette's fielding run number will not increase by switching from shortstop because his lateral movement projects to be average, at best. The Impact of Bichette's 2024 Season From 2021 to 2023, Bichette averaged 4.5 fWAR per season. In 2024, Bichette posted a 0.3 fWAR in 81 games. Most projections place Bichette's 2025 season in the 3.5 to 3.8 fWAR range. Also, during his career, Bichette is an average baserunner (+1 Baserunning Runs), and his defence is average, at best. Accordingly, Bichette's value-added depends on his bat. He is a career 119 wRC+ batter, which is very good but not great. Given the potential position change and other noted factors, a 2026 4.0 fWAR projection is reasonable. The Impact of the Guerrero Jr. and Juan Soto Contracts It is challenging for teams, players, and MLB observers to estimate the current dollar value per fWAR figure. For a Bichette contract estimate, I need to determine the $/fWAR number for the 2026 season. Here is my attempt. In December 2022, Aaron Judge signed a nine-year, $360 million contract with the New York Yankees. Based on Steamer's 2023 6.9 fWAR estimate, according to my model, the implied 2023 $/fWAR was $8.8 million and $9.4 million for the 2025 season. When the most recent free agent period began, MLB Trade Rumors's estimate for a Juan Soto contract was a 13-year, $600 million deal. Given Steamer's 2025 Soto 6.0 fWAR projection, the implied 2025 $/fWAR was $9.4 million. The $9.4 million figure was the implied rate for MLBTR's Willy Adames's six-year, $160 million contract estimate. Adames signed a seven-year, $182 million deal, corresponding to $10.1 million per fWAR in 2025. That is close to MLBTR's and Judge's 2025 implied $9.4 million. So, does the implied 2025 $10.1 million per fWAR work for the Guerrero Jr. and Soto contracts? No, not even close. Please refer to Table 5. Ultimately, Soto signed a 15-year, $765 million deal. After adjusting for the additional two years and the higher $/fWAR ($10.1 million versus $9.4 million), I arrived at a 15-year, $640 million deal. The implied premium paid by the Mets to land Soto was $125 million ($765 million less $640 million). The premium is understandable. First, suppose the $125 million is paid evenly over 15 years. With a 5% discount rate, the present value of the premium is approximately $86 million, not as astounding as the $125 million sticker price. Second, the bidders included the Mets and the Yankees. Accordingly, a bidding war between teams with deep pockets was likely to push the $/fWAR upwards. According to my model, Toronto paid a $96 million premium to sign Guerrero Jr. to an extension. The Blue Jays were probably willing to pay more than the market $/fWAR for multiple reasons, including their preference to field a competitive team beyond 2025, maintaining or increasing revenues with Guerrero Jr. to cover the Rogers Centre's renovation costs, and other considerations. I acknowledge that the estimated Soto and Guerrero Jr. premiums are projections, not known prices. For example, New York's projected fWAR for Soto could be higher than mine, which would reduce the premium. However, because MLBTR has a good record regarding contract estimates, there were probably abnormal factors that caused Soto's deal to exceed expectations. Also, it is unusual for Year 1 $/fWAR to change significantly from one year to the next. According to my calculation, the $/fWAR increased from $9.4 million to $12.0 million for Soto. Lastly, Soto's $12.0 million $/fWAR is substantially higher than Adames's $10.1 million. These points suggest that the Mets and Blue Jays paid premiums, perhaps not as large as $125 million and $96 million, to secure the players. The special circumstances that led the Mets and Blue Jays to pay significant premiums to Soto and Guerrero Jr. will not apply to Bichette. He is not as valuable to Toronto as Guerrero Jr. Accordingly, I used $10.4 million/fWAR (2025's $ 10.1 million, increased by 3%) for Bichette's contract estimate. Contract Estimates Table 6 shows multiple contract estimates. The variables for the projections are contract length (eight or ten years) and first-year fWAR (4.5, 4.0 or 3.5). Because a starting 4.0 fWAR is reasonable, a 10-year, $283.4 million deal or an eight-year, $267.5 million agreement would be sensible. The tenth year of the contract would be Bichette's age-37 season. The present value of the 10-year deal is slightly higher than that of the eight-year contract. One advantage of the 10-year agreement is that the lower AAV ($28.3 million versus $33.4 million) would result in a lower competitive balance tax number. Will Bichette accept my reasonable contract? I have no idea, but it's fun to speculate. The Last Word Bichette is an average-ish fielder and baserunner. However, he is a very good hitter, which, given Toronto's need to bolster its offence, is worth retaining beyond 2025. Furthermore, the Blue Jays seem to have decided to compete for multiple postseason berths after 2025. The Guerrero Jr. extension is consistent with that goal, as would signing Bichette to a new, but reasonable, contract. View full article
-
On Saturday, the Blue Jays led 2-0 after six innings but lost 3-2. Were John Schneider’s bullpen decisions reasonable? Chris Bassitt pitched six and two-thirds innings against the Mets on Saturday. Entering the seventh, Bassitt scattered a triple (Jesse Winker) and two doubles (Francisco Lindor and Winker) and posted nine strikeouts and no walks through six innings. In the seventh, he retired the first two batters on weak ground outs (the exit velocities were 84.1 mph and 66.4 mph). The next batter, Mark Vientos, hit a line drive to left field (99.4 mph exit velocity). Bassitt’s outing ended when Schneider turned to Yimi García as Bassitt’s replacement. The next three hitters were at the bottom of New York’s batting order. Those hitters (Brett Baty, Jose Siri, and Hayden Senger) all struck out in the fifth inning. Bassitt had thrown 92 pitches when he left the game, and it was a cold night in New York. Whether John Schneider should have replaced Bassitt at that point in the game is a matter for debate. However, there is a strong case that the manager’s reliever choices were highly questionable. The Coin Flip Jim Scott, a colleague at JaysCentre, often poses the following scenario. Suppose someone offers you a coin-flip opportunity. You can pick heads or tails, and you selected heads. If the coin comes up heads, you win $5; if it's tails, you pay $2. Given that the odds are 50/50 that the coin flip will be heads, you calculate your expected value to be $1.50 (50% of $5 less 50% of $2). Accordingly, you agree to the bet terms. The person who made the offer flips the coin, and it lands on tails. You lose $2. Did you make a good decision? Yes, because your expected value of the bet was +$2.50. Unfortunately, your decision did not work out. I will revisit this concept later in the article. The Recap After Bassitt’s Exit García replaced Bassitt with two outs in the seventh. Baty placed a single in right field with an 80.0 mph exit velocity, and Siri walked on four pitches to load the bases. Starling Marte pinch-hit for Senger and grounded out softly (44.7 mph exit velocity) to end the inning. García threw 10 pitches in total. Brendon Little took the mound to start the eighth. Lindor walked, Juan Soto blooped a single (73.4 mph exit velocity), Pete Alonso struck out, Brandon Nimmo lined out to center (105.1 mph exit velocity), and the Mets scored two runs on Winker’s triple (99.8 mph exit velocity). Schneider replaced Little with Nick Sandlin, who struck out Vientos to close the bottom of the eighth. Sandlin returned to begin the ninth. Baty grounded out (107.1 mph exit velocity), Siri walked and soon advanced to second on a Sandlin wild pitch, and Luis Torrens dropped a soft single into left (71.7 mph exit velocity). Jeff Hoffman entered the game with one out and runners at the corners, but unfortunately for Toronto, Lindor greeted Hoffman with a sacrifice fly that scored Siri. A 3-2 loss for Toronto. Why the Bullpen Decisions are Questionable In high-leverage situations, teams utilize their best relievers differently than they did many years ago. For example, suppose the game is close in the eighth inning and the opposing team has the top of their order due up. Many moons ago, a manager was likely to save his closer for the ninth and use another reliever instead. In 2025, many managers will bring the closer into the game in the eighth to face the opposition’s best hitters in that high-leverage situation. In high-leverage situations from 2022 to 2024, García and Hoffman allowed wOBA of .279 and .211, respectively. The 2024 MLB average wOBA in high-leverage situations was .307. For this reason, I would argue that they are ideally suited to be high-leverage relievers this season. Let’s revisit Saturday’s game. When Bassitt exited, the number seven, eight, and nine hitters were due up. Although Toronto had a slim lead (2-0), the situation was medium leverage, not high. Accordingly, Schneider had options other than Garcia as Bassitt’s replacement. Table time! Please refer to Tables 1 and 2. Table 1 shows that Chad Green, Sandlin, Little, García, and Hoffman were well-rested for Saturday’s game. Table 2 shows that Green and Sandlin, whose career wOBA splits are better than the 2024 MLB average, were viable options to face Baty. Therefore, Green or Sandlin could have replaced Bassitt and produced the final out. Suppose Schneider selected Green instead of García and Baty was the final out. Toronto could have brought Green back in the eighth inning to face the number eight and nine hitters and have the option to have Green or García face Lindor. Alternatively, García could have started the eighth inning. Assuming Green and García performed well, Hoffman could have taken the mound in the ninth inning to close the game. Alternatively, Hoffman could have entered the game in the eighth, saving García for the ninth. My analysis is not a case of judging a decision by the result. The decision to replace Bassitt with García, Garcia with Little, and Little with Sandlin was suboptimal. The better option would have been Green or Sandlin as Bassitt’s replacement and using García and Hoffman in the eighth and ninth innings. Furthermore, if Schneider brought García into the game in the seventh because Schneider believed that was a high-leverage situation, why not use Hoffman in the eighth? The eighth was high leverage because the score was close and the top of New York’s batting order was on the horizon. Schneider’s error in judgment was as much what he chose to do in the eighth as what he did in the seventh. The Last Word Judging a decision by the result is easy but not the correct approach. One should evaluate the soundness of a decision based on the information available when the person makes the choice. Accordingly, given that information, was the decision optimal? In other words, did the choice make sense? There were many unknowns on Saturday, including how the relievers would perform. Like the coin flip example, Schneider’s bullpen decisions did not work out. However, unlike the coin flip example, Schneider’s decision was not sound. A reasonable decision would be to bring Green or Sandlin into the game in the seventh inning, a medium-leverage situation, thereby preserving García and Hoffman for the eighth and ninth innings. A less optimal choice, but better than Schneider’s decision to have Little enter the game in the eighth, would have been to use Hoffman in that inning. In summary, not every criticism of a decision is a case of 20/20 hindsight. Some decisions were not reasonable when made. View full article
- 3 replies
-
- 3
-
-
- yimi garcia
- jeff hoffman
- (and 1 more)
-
 Chris Bassitt pitched six and two-thirds innings against the Mets on Saturday. Entering the seventh, Bassitt scattered a triple (Jesse Winker) and two doubles (Francisco Lindor and Winker) and posted nine strikeouts and no walks through six innings. In the seventh, he retired the first two batters on weak ground outs (the exit velocities were 84.1 mph and 66.4 mph). The next batter, Mark Vientos, hit a line drive to left field (99.4 mph exit velocity). Bassitt’s outing ended when Schneider turned to Yimi García as Bassitt’s replacement. The next three hitters were at the bottom of New York’s batting order. Those hitters (Brett Baty, Jose Siri, and Hayden Senger) all struck out in the fifth inning. Bassitt had thrown 92 pitches when he left the game, and it was a cold night in New York. Whether John Schneider should have replaced Bassitt at that point in the game is a matter for debate. However, there is a strong case that the manager’s reliever choices were highly questionable. The Coin Flip Jim Scott, a colleague at JaysCentre, often poses the following scenario. Suppose someone offers you a coin-flip opportunity. You can pick heads or tails, and you selected heads. If the coin comes up heads, you win $5; if it's tails, you pay $2. Given that the odds are 50/50 that the coin flip will be heads, you calculate your expected value to be $1.50 (50% of $5 less 50% of $2). Accordingly, you agree to the bet terms. The person who made the offer flips the coin, and it lands on tails. You lose $2. Did you make a good decision? Yes, because your expected value of the bet was +$2.50. Unfortunately, your decision did not work out. I will revisit this concept later in the article. The Recap After Bassitt’s Exit García replaced Bassitt with two outs in the seventh. Baty placed a single in right field with an 80.0 mph exit velocity, and Siri walked on four pitches to load the bases. Starling Marte pinch-hit for Senger and grounded out softly (44.7 mph exit velocity) to end the inning. García threw 10 pitches in total. Brendon Little took the mound to start the eighth. Lindor walked, Juan Soto blooped a single (73.4 mph exit velocity), Pete Alonso struck out, Brandon Nimmo lined out to center (105.1 mph exit velocity), and the Mets scored two runs on Winker’s triple (99.8 mph exit velocity). Schneider replaced Little with Nick Sandlin, who struck out Vientos to close the bottom of the eighth. Sandlin returned to begin the ninth. Baty grounded out (107.1 mph exit velocity), Siri walked and soon advanced to second on a Sandlin wild pitch, and Luis Torrens dropped a soft single into left (71.7 mph exit velocity). Jeff Hoffman entered the game with one out and runners at the corners, but unfortunately for Toronto, Lindor greeted Hoffman with a sacrifice fly that scored Siri. A 3-2 loss for Toronto. Why the Bullpen Decisions are Questionable In high-leverage situations, teams utilize their best relievers differently than they did many years ago. For example, suppose the game is close in the eighth inning and the opposing team has the top of their order due up. Many moons ago, a manager was likely to save his closer for the ninth and use another reliever instead. In 2025, many managers will bring the closer into the game in the eighth to face the opposition’s best hitters in that high-leverage situation. In high-leverage situations from 2022 to 2024, García and Hoffman allowed wOBA of .279 and .211, respectively. The 2024 MLB average wOBA in high-leverage situations was .307. For this reason, I would argue that they are ideally suited to be high-leverage relievers this season. Let’s revisit Saturday’s game. When Bassitt exited, the number seven, eight, and nine hitters were due up. Although Toronto had a slim lead (2-0), the situation was medium leverage, not high. Accordingly, Schneider had options other than Garcia as Bassitt’s replacement. Table time! Please refer to Tables 1 and 2. Table 1 shows that Chad Green, Sandlin, Little, García, and Hoffman were well-rested for Saturday’s game. Table 2 shows that Green and Sandlin, whose career wOBA splits are better than the 2024 MLB average, were viable options to face Baty. Therefore, Green or Sandlin could have replaced Bassitt and produced the final out. Suppose Schneider selected Green instead of García and Baty was the final out. Toronto could have brought Green back in the eighth inning to face the number eight and nine hitters and have the option to have Green or García face Lindor. Alternatively, García could have started the eighth inning. Assuming Green and García performed well, Hoffman could have taken the mound in the ninth inning to close the game. Alternatively, Hoffman could have entered the game in the eighth, saving García for the ninth. My analysis is not a case of judging a decision by the result. The decision to replace Bassitt with García, Garcia with Little, and Little with Sandlin was suboptimal. The better option would have been Green or Sandlin as Bassitt’s replacement and using García and Hoffman in the eighth and ninth innings. Furthermore, if Schneider brought García into the game in the seventh because Schneider believed that was a high-leverage situation, why not use Hoffman in the eighth? The eighth was high leverage because the score was close and the top of New York’s batting order was on the horizon. Schneider’s error in judgment was as much what he chose to do in the eighth as what he did in the seventh. The Last Word Judging a decision by the result is easy but not the correct approach. One should evaluate the soundness of a decision based on the information available when the person makes the choice. Accordingly, given that information, was the decision optimal? In other words, did the choice make sense? There were many unknowns on Saturday, including how the relievers would perform. Like the coin flip example, Schneider’s bullpen decisions did not work out. However, unlike the coin flip example, Schneider’s decision was not sound. A reasonable decision would be to bring Green or Sandlin into the game in the seventh inning, a medium-leverage situation, thereby preserving García and Hoffman for the eighth and ninth innings. A less optimal choice, but better than Schneider’s decision to have Little enter the game in the eighth, would have been to use Hoffman in that inning. In summary, not every criticism of a decision is a case of 20/20 hindsight. Some decisions were not reasonable when made.
- 3 comments
-
- 1
-
-
- yimi garcia
- jeff hoffman
- (and 1 more)
-
The Kirk signing is a terrific deal. A reasonable total fWAR is 14.5 over the five years. At $9.3 million per fWAR for the 2026 season (it is approximately $9.0 million in 2025, which I inflated 3% annually) and other assumptions (aging, cost of the arb-3 season, etc.), I arrive at a $132.1 million deal. One could argue that because Kirk is a catcher with a particular body type, $132.1 million is excessive. However, even if you knock the value to $100 million, or even $75 million, it is a good deal for Toronto. Kirk probably considers this contract financial security for him and his family. At the end of the term, he will enter his age-32 season as a free agent and earn more money. I can see why Kirk would sign this extension.
-
The baseball media is mischaracterizing the actual value of contracts with deferred money. Let's get it straight. How often have you read or heard the following? "The present value of Toronto's offer to Vladimir Guerrero Jr. is X million dollars?" I'm here to tell you that those X million-dollar present value statements are incorrect. Why should people care if someone has misapplied the present value concept? Consider last week's report that Toronto's offer to Guerrero was close to $500 million, but the present value was closer to $450 million because of deferrals. As I will illustrate, the present value of Toronto's offer was possibly $321.1 million and considerably less than $450 million. Also, Guerrero's ask was likely much less than the reported $500 million present value figure. Therefore, the ensuing discussion among other media members and fans is significantly distorted because media reports include the present value error. Also, as an accountant, I am offended! (No, not really.) The best way to illustrate the present value error is three-fold. First, explain the present value concept. Second, review MLB's average annual value (AAV) calculation, and third, examine Shohei Ohtani's contract. Present Value How often has someone remarked that "a dollar today is worth more than a dollar tomorrow?" This expression is the principle behind the present value financial concept. Present value (PV) is the current value of all future cash flow streams. Consider the table below, courtesy of Initiatewebdevelopment.com. Suppose the interest rate is 8%, and there is neither credit risk nor income taxes. You would be indifferent if a person offered you $100 four years from now or $73.50 immediately. Why? Because you could invest the $73.50 at an annual compound 8% rate and have $100 in four years [$73.50 x (1+0.08)^4]. You can also find the answer in the present value table. Scroll down the Period column until you find the number 4, then along that row to the 8% column, where you will find the number 0.7350. Multiply $100 by 0.7350 to arrive at $73.50. The PV model is a valuable analysis tool. However, some people, including media members, misapply the PV concept. MLB's AAV Calculation For MLB's Competitive Balance Tax purposes, teams need to determine the AAV of each contract. For a given contract, if no deferrals exist, the calculation is straightforward: divide the total contract value by the term. For example, the AAV of a 10-year, $100-million contract with no deferrals is $10 million. If a contract has deferrals, the calculation is more complicated. FanGraphs' Jon Becker explained the AAV calculation for the Ohtani contract clearly. The Ohtani Contract The sticker price of the Ohtani deal was $700 million over 10 years. However, because of MLB practice, a value of the deferred payments is determined for CBT purposes. Accordingly, the PV of the first $68 million, deferred for 10 years, is $44.1 million. As per MLB practice, the same $44.1 million is used for the other nine deferred payments, and the sum of these deferred amounts is approximately $440.8 million. The same $44.1 million figure is used because the other nine deferred amounts are $68 million and are deferred for 10 years. To arrive at the $460.8 million CBT figure, add the $20 million salary paid during Ohtani's playing time. Therefore, for CBT purposes, the AAV is $46.1 million [($460.8 million) / 10). See Table 1 for the details. Many people will refer to the $460.8 million as the PV of the Ohtani deal, but that is incorrect. MLB uses the $460.8 million figure for CBT purposes, but it is not the PV of the Ohtani contract. What is the PV? Recall that the PV definition is the current value of all future streams of cashflows. The PV of all payments ($2 million annually in the first 10 years and $68 million annually in years 11 through 20) is $365.9 million (a 4.43% discount rate). As shown in Table 1, you arrive at the same $365.9 million amount if you calculate the PV of the $460.8 million CBT amount over 10 years. Why 10 years? Because the $460.8 million represents the total if the Dodgers were to pay Ohtani over 10 years. Hence, the PV of Ohtani's deal is $365.9 million, whether you discount the $700 million over 20 years or $460.8 million over 10 years. That constitutes a huge difference. If you're referring to the CBT figure, you're overstating the actual present value of Ohtani's contract by an enormous $94.9 million. In summary, be careful when someone states that the PV of a given contract is $X million. As illustrated above, that person probably unknowingly refers to the amount for CBT purposes, not the PV of the cashflows. Let's bring the PV concept to Guerrero and the reported contract demands and offers. Guerrero Jr. In the first paragraph, I linked to an MLB Trade Rumors article about a recent report on Guerrero's contract demands. According to the report, Guerrero is requesting a $500-million PV contract. Well, guess what? We have another PV misstatement. If Guerrero wants a 14-year deal with a $500 million PV, then a $707 million contract, paid equally throughout the 14-year term, generates a $500.0 million PV (5% discount rate). Given that Guerrero Jr. has stated that his ask was less than $600 million, and assuming 14 years is his desired term, the reported $500 million PV is another example of a PV misstatement. I suspect the $500 million figure refers to the number used for the CBT calculation. Another report had Toronto offering a deal close to $500 million. With deferrals, the reported PV was close to $450 million. Yep, PV misstatement alert! Let's run through an example that approximates Toronto's reported offer. Consider a 14-year, $490-million hypothetical contract. In each of the first seven years, the Blue Jays would defer the payment of $13 million to Guerrero for 14 years. In other words, in Year 1, $13 million is deferred and paid in Year 15, the same amount is deferred in Year 2 and paid in Year 16, and so on. All payments occur over 21 years. The amount for CBT purposes is $445 million, close to the erroneously reported $450 million PV figure. The actual PV of this hypothetical deal is $320.1 million (discounted at 5%). Contract Talk I will jump into the Guerrero Jr. contract estimate game, as shown in Table 2 below. Suppose Toronto would pay the $402.5 million over 14 years, with $13-million deferrals, as described in the $490-million example. Table 2's footnotes explain the calculation details. A contract worth $402.5 million is on the high side because there are some risks to consider. First, the projected performance does not factor in physical decline more than the average age-related deterioration. There are valid concerns regarding Guerrero's durability. Second, the estimate does not reflect a position change from first base to full-time DH, which would reduce his value to the team. Third, the projection assumes consistent year-to-year performance, ignoring the impact of aging. Guerrero's performance has not been consistent. Over the past four seasons, he's put up fWAR totals of 6.3, 3.3, 1.3, and 5.4; none of those figures is within 0.8 WAR of any of the others. If these risks materialize, the projected fWAR total is too high, and accordingly, the money paid by the Blue Jays will be excessive. Bringing the PV Lesson Home Consider Table 3. The first contract is my $402.5-million estimate, and the second is our prior $490-million deal. The third contract exemplifies Guerrero's $500-million PV contract ask. The sticker price is $545 million with the same deferral terms as the other Table 3 contracts. Let's talk PV. The PV of the $545-million deal is $359 million, higher than my $402.5-million deal (a $258.2-million PV). Put another way, the PV of the $545-million contract is 39% higher than the PV of my proposed deal. The $490-million contract has a PV that's 24% higher than my contract estimate. Given the risks I noted earlier, the PV premiums (39% and 24%) are considerable. If I were Ed Rogers, I would be very uncomfortable with a 14-year, $402.5-million Guerrero Jr. contract. The Last Word No matter how one feels about the sticker price of a Guerrero contract, the PV concept is a valuable analysis tool. When used appropriately, it allows the analyst to compare the actual values of contracts with different payment structures. The reader should ignore the typical claims that Guerrero's offer or request has a PV of X. Instead, calculate the correct PV of a given contract or ask an accountant to do it. View full article
-
 How often have you read or heard the following? "The present value of Toronto's offer to Vladimir Guerrero Jr. is X million dollars?" I'm here to tell you that those X million-dollar present value statements are incorrect. Why should people care if someone has misapplied the present value concept? Consider last week's report that Toronto's offer to Guerrero was close to $500 million, but the present value was closer to $450 million because of deferrals. As I will illustrate, the present value of Toronto's offer was possibly $321.1 million and considerably less than $450 million. Also, Guerrero's ask was likely much less than the reported $500 million present value figure. Therefore, the ensuing discussion among other media members and fans is significantly distorted because media reports include the present value error. Also, as an accountant, I am offended! (No, not really.) The best way to illustrate the present value error is three-fold. First, explain the present value concept. Second, review MLB's average annual value (AAV) calculation, and third, examine Shohei Ohtani's contract. Present Value How often has someone remarked that "a dollar today is worth more than a dollar tomorrow?" This expression is the principle behind the present value financial concept. Present value (PV) is the current value of all future cash flow streams. Consider the table below, courtesy of Initiatewebdevelopment.com. Suppose the interest rate is 8%, and there is neither credit risk nor income taxes. You would be indifferent if a person offered you $100 four years from now or $73.50 immediately. Why? Because you could invest the $73.50 at an annual compound 8% rate and have $100 in four years [$73.50 x (1+0.08)^4]. You can also find the answer in the present value table. Scroll down the Period column until you find the number 4, then along that row to the 8% column, where you will find the number 0.7350. Multiply $100 by 0.7350 to arrive at $73.50. The PV model is a valuable analysis tool. However, some people, including media members, misapply the PV concept. MLB's AAV Calculation For MLB's Competitive Balance Tax purposes, teams need to determine the AAV of each contract. For a given contract, if no deferrals exist, the calculation is straightforward: divide the total contract value by the term. For example, the AAV of a 10-year, $100-million contract with no deferrals is $10 million. If a contract has deferrals, the calculation is more complicated. FanGraphs' Jon Becker explained the AAV calculation for the Ohtani contract clearly. The Ohtani Contract The sticker price of the Ohtani deal was $700 million over 10 years. However, because of MLB practice, a value of the deferred payments is determined for CBT purposes. Accordingly, the PV of the first $68 million, deferred for 10 years, is $44.1 million. As per MLB practice, the same $44.1 million is used for the other nine deferred payments, and the sum of these deferred amounts is approximately $440.8 million. The same $44.1 million figure is used because the other nine deferred amounts are $68 million and are deferred for 10 years. To arrive at the $460.8 million CBT figure, add the $20 million salary paid during Ohtani's playing time. Therefore, for CBT purposes, the AAV is $46.1 million [($460.8 million) / 10). See Table 1 for the details. Many people will refer to the $460.8 million as the PV of the Ohtani deal, but that is incorrect. MLB uses the $460.8 million figure for CBT purposes, but it is not the PV of the Ohtani contract. What is the PV? Recall that the PV definition is the current value of all future streams of cashflows. The PV of all payments ($2 million annually in the first 10 years and $68 million annually in years 11 through 20) is $365.9 million (a 4.43% discount rate). As shown in Table 1, you arrive at the same $365.9 million amount if you calculate the PV of the $460.8 million CBT amount over 10 years. Why 10 years? Because the $460.8 million represents the total if the Dodgers were to pay Ohtani over 10 years. Hence, the PV of Ohtani's deal is $365.9 million, whether you discount the $700 million over 20 years or $460.8 million over 10 years. That constitutes a huge difference. If you're referring to the CBT figure, you're overstating the actual present value of Ohtani's contract by an enormous $94.9 million. In summary, be careful when someone states that the PV of a given contract is $X million. As illustrated above, that person probably unknowingly refers to the amount for CBT purposes, not the PV of the cashflows. Let's bring the PV concept to Guerrero and the reported contract demands and offers. Guerrero Jr. In the first paragraph, I linked to an MLB Trade Rumors article about a recent report on Guerrero's contract demands. According to the report, Guerrero is requesting a $500-million PV contract. Well, guess what? We have another PV misstatement. If Guerrero wants a 14-year deal with a $500 million PV, then a $707 million contract, paid equally throughout the 14-year term, generates a $500.0 million PV (5% discount rate). Given that Guerrero Jr. has stated that his ask was less than $600 million, and assuming 14 years is his desired term, the reported $500 million PV is another example of a PV misstatement. I suspect the $500 million figure refers to the number used for the CBT calculation. Another report had Toronto offering a deal close to $500 million. With deferrals, the reported PV was close to $450 million. Yep, PV misstatement alert! Let's run through an example that approximates Toronto's reported offer. Consider a 14-year, $490-million hypothetical contract. In each of the first seven years, the Blue Jays would defer the payment of $13 million to Guerrero for 14 years. In other words, in Year 1, $13 million is deferred and paid in Year 15, the same amount is deferred in Year 2 and paid in Year 16, and so on. All payments occur over 21 years. The amount for CBT purposes is $445 million, close to the erroneously reported $450 million PV figure. The actual PV of this hypothetical deal is $320.1 million (discounted at 5%). Contract Talk I will jump into the Guerrero Jr. contract estimate game, as shown in Table 2 below. Suppose Toronto would pay the $402.5 million over 14 years, with $13-million deferrals, as described in the $490-million example. Table 2's footnotes explain the calculation details. A contract worth $402.5 million is on the high side because there are some risks to consider. First, the projected performance does not factor in physical decline more than the average age-related deterioration. There are valid concerns regarding Guerrero's durability. Second, the estimate does not reflect a position change from first base to full-time DH, which would reduce his value to the team. Third, the projection assumes consistent year-to-year performance, ignoring the impact of aging. Guerrero's performance has not been consistent. Over the past four seasons, he's put up fWAR totals of 6.3, 3.3, 1.3, and 5.4; none of those figures is within 0.8 WAR of any of the others. If these risks materialize, the projected fWAR total is too high, and accordingly, the money paid by the Blue Jays will be excessive. Bringing the PV Lesson Home Consider Table 3. The first contract is my $402.5-million estimate, and the second is our prior $490-million deal. The third contract exemplifies Guerrero's $500-million PV contract ask. The sticker price is $545 million with the same deferral terms as the other Table 3 contracts. Let's talk PV. The PV of the $545-million deal is $359 million, higher than my $402.5-million deal (a $258.2-million PV). Put another way, the PV of the $545-million contract is 39% higher than the PV of my proposed deal. The $490-million contract has a PV that's 24% higher than my contract estimate. Given the risks I noted earlier, the PV premiums (39% and 24%) are considerable. If I were Ed Rogers, I would be very uncomfortable with a 14-year, $402.5-million Guerrero Jr. contract. The Last Word No matter how one feels about the sticker price of a Guerrero contract, the PV concept is a valuable analysis tool. When used appropriately, it allows the analyst to compare the actual values of contracts with different payment structures. The reader should ignore the typical claims that Guerrero's offer or request has a PV of X. Instead, calculate the correct PV of a given contract or ask an accountant to do it.
.jpg.618bb6f9c0d11a75a2615d002aa743a8.jpg)
.jpg.c179bfed36879ed9e7e48d78bb7fd90e.jpg)
.jpg.67edd51d553c67e51a1c6a0fd6ee16c7.jpg)
.jpg.b4fdf1303f82917e739ad2a0d41a81a1.jpg)
.jpg.fa845c3bbdb1f29f32638aa88cd3744d.jpg)
