

Bob Ritchie
-
Posts
112 -
Joined
-
Last visited
-
Days Won
1
Content Type
Profiles
Toronto Blue Jays Videos
2026 Toronto Blue Jays Top Prospects Ranking
Toronto Blue Jays Free Agent & Trade Rumors, Notes, & Tidbits
Guides & Resources
2025 Toronto Blue Jays Draft Pick Tracker
News
2026 Toronto Blue Jays Draft Tracker: Picks & Bonuses
Forums
Blogs
Events
Store
Downloads
Gallery
Everything posted by Bob Ritchie
-
On July 27, 2024, the Blue Jays acquired Yohendrick Piñango and Josh Rivera from the Cubs in exchange for Nate Pearson. Last season, Piñango posted a 124 wRC+ with the Buffalo Bisons. However, Toronto left him off the 40-man roster before the Rule 5 draft. Fortunately for the Blue Jays, another team did not select him. Let us take a deeper dive into Piñango’s numbers. Since Piñango made his MLB debut on April 26, he has been one of the Blue Jays’ better hitters. As of May 25, his .342 OBP ranked second on the team, and his .333 wOBA and .403 SLG were the team's fourth-highest. In the field, many scouts considered his defence to be below average. Entering the May 25 game, Piñango had a 1 OAA and 0 FRV in limited innings (144). However, that evening, he misplayed two very makeable catches, which are not reflected in those OAA and FRV numbers. Also, he is not fleet of foot (44th percentile in sprint speed). For a more fulsome prospect report, please refer to the Jays Centre’s top prospect rankings. From a batted ball perspective, he is a straightaway hitter. Piñango’s pull rate is 32.7%, lower than the 37.4% MLB average. His straightaway contact rate is 43.6%, higher than the MLB average of 37.3%. Regarding opposite field rate, the MLB average is 25.1%, higher than Piñango’s 23.6% mark. He is also a contact hitter, as shown by his 83.7% contact rate (74.7% MLB average) and swings at pitches out of the zone at a 32.0% clip, slightly higher than MLB’s 30.1% average chase rate. Piñango’s strikeout, walk, and whiff rate marks are 17.1%, 5.3% and 19.9%, respectively. Those scores are lower than the corresponding MLB averages (22.1%, 9.3%, and 25.3%). Generating power is an area where Piñango lags the average MLB hitter: his .097 ISO and .099 xISO trail MLB’s average .148 ISO and .155 xISO. There are three reasons why Piñango has produced below-average power numbers. First, his pull rate lags the MLB average. On batted balls pulled, hit straightaway and to the opposite field, the MLB average ISO numbers are .312, .112 and .139, respectively. Piñango’s opportunity to generate ISO is limited due to his below-average amount of pulled contact. The second reason is launch angle. The MLB average launch angle is 13 degrees, whereas Piñango’s is 7 degrees. Consider that, on batted balls with a launch angle between 0 and 10 degrees, the average ISO and xISO are .065 and .071, respectively. Contrast those figures with launch angles between 11 and 15 degrees, on which the average ISO and xISO are .182 and .192, respectively. If Piñango could raise his average launch angle, we should observe higher ISO numbers. The third factor that negatively impacts Piñango’s power numbers is his attack angle/timing. According to the MLB website, attack angle is “in large part a timing metric, as the hitter’s attack angle is constantly changing throughout the course of the swing … When the hitter is behind the pitch with his swing (i.e., too late), he will tend to have a lower attack angle.” The MLB average attack angle is 9 degrees, but Piñango’s is -1 degree. Regarding ideal attack angle rate, his 21.9% is well below the MLB average of 48.8%. For context, the average ISO on batted balls with an attack angle between 5 and 20 degrees is .203. Concerning Piñango’s average attack angle, the MLB average ISO on batted balls with an attack angle between -1 and 4 degrees is .081. Notably, an issue for Piñango is not bat speed, as his average is 73.7 mph, faster than the MLB average of 69.8 mph. Therefore, as he gains MLB experience, if Piñango can generate a higher pull rate, launch angle and attack angle, he should post better power numbers. Now, to the question of whether Piñango should be Buffalo-bound when Barger returns, let us peek at a long-overdue table! SLG wOBA ISO OBP # Rank # Rank # Rank # Rank Lukes 0.357 10 0.309 8 0.071 13 0.328 5 Piñango 0.403 4 0.333 4 0.097 9 0.342 2 Sánchez 0.435 2 0.327 6 0.156 4 0.315 7 Straw 0.349 11 0.300 9 0.108 8 0.312 8 Varsho 0.420 3 0.336 3 0.155 5 0.338 3 Schneider 0.211 13 0.254 12 0.085 11 0.295 9 Sosa 0.286 12 0.214 13 0.091 10 0.203 13 MLB Average 0.387 0.316 0.148 0.318 Higher than MLB Average: Source: Baseball Savant. Data is as of May 25. The metrics I selected for the table are those with the highest correlation with scoring runs. In a prior article, I calculated regression results for the last 11 162-game regular seasons (2013-2019 and 2021-2024) with various metrics and runs. Why the focus on runs? Toronto ranks 22nd in runs per game as of May 25. Concerning the decision to make room for Barger, one of the factors the Blue Jays should consider is a player’s performance in metrics that lead to run scoring. As shown in the table, Piñango’s SLG, wOBA and OBP are better than the MLB average. Furthermore, his SLG, wOBA and OBP rankings among the 2026 Blue Jays with at least 50 plate appearances are fourth, fourth and second, respectively. His xSLG, xwOBA, and xOBP numbers are marginally below the corresponding MLB averages. Accordingly, except for ISO, Piñango’s metrics that are strongly correlated with run-scoring scream, “No Buffalo for the rookie!” However, there are other issues to consider. The table demonstrates that Piñango has generated better numbers than Lenyn Sosa. However, if Toronto removed Sosa from the 26-man roster instead of Piñango, Sosa would have to clear waivers because he has no MiLB options remaining. Given that Sosa has been awful (32 wRC+), losing him to waivers would not be catastrophic, to say the least. Nevertheless, the primary concern is that Sosa is Toronto’s only backup middle infielder. If the Blue Jays add Barger, keep Piñango and cut ties with Sosa, Toronto will have six outfielders (Piñango, Barger, Nathan Lukes, Daulton Varsho, Jesús Sánchez, and Myles Straw). Who would play second base or shortstop if Andrés Giménez or Ernie Clement were not available? Therefore, Toronto needs a backup middle infielder, but it does not need to be Sosa. Perhaps Davis Schneider can rebound after his stint in Buffalo, or a Buffalo Bison (Josh Kasevich) can replace Sosa. Of course, there is always the possibility that Toronto could add a middle infielder from the trade market. Lastly, a topic for another day is the batter-handedness of Toronto’s outfielders. Of the six, including Piñango, only one (Straw) is a right-handed batter. As of May 25, Toronto’s outfielders have a 65 wRC+ versus left-handed pitchers, which ranks 24th. Against right-handed pitchers, the Blue Jays’ outfielders have posted a 109 wRC+, good for ninth-best. At some point this season, Toronto’s management should add a lefty-masher to the outfield mix. What does this mean for Piñango when Barger returns? Unfortunately, he appears to be the one who would be Buffalo-bound. Suppose Toronto wants to carry 13 pitchers on the 26-man roster. Accordingly, there will be eight slots occupied by non-outfielders: four infielders, two catchers, one designated hitter, and one middle infielder. Hence, Toronto will deploy five outfielders. Barger, Sánchez, and Varsho should remain because they offer the power that the team needs. Lukes and Straw offer flexibility because they can play more than one outfield position well. The three primary strikes against Piñango remaining on the 26-man roster are his below-average power (ISO), his left-handed bat for a team with a surplus of left-handed-hitting outfielders, and his recent defensive woes. Hence, the game of roster musical chairs leaves Piñango standing (in Buffalo). The Last Word Piñango has had a particularly good season thus far. Since joining the big league club in April, he has produced a 112 wRC+ and a 0.4 fWAR. However, with Barger's imminent return, Toronto will have one too many outfielders, and Piñango will likely be Buffalo-bound. View full article
-
.jpg.5114cbe747dff3442088d6a30a951534.jpg) On July 27, 2024, the Blue Jays acquired Yohendrick Piñango and Josh Rivera from the Cubs in exchange for Nate Pearson. Last season, Piñango posted a 124 wRC+ with the Buffalo Bisons. However, Toronto left him off the 40-man roster before the Rule 5 draft. Fortunately for the Blue Jays, another team did not select him. Let us take a deeper dive into Piñango’s numbers. Since Piñango made his MLB debut on April 26, he has been one of the Blue Jays’ better hitters. As of May 25, his .342 OBP ranked second on the team, and his .333 wOBA and .403 SLG were the team's fourth-highest. In the field, many scouts considered his defence to be below average. Entering the May 25 game, Piñango had a 1 OAA and 0 FRV in limited innings (144). However, that evening, he misplayed two very makeable catches, which are not reflected in those OAA and FRV numbers. Also, he is not fleet of foot (44th percentile in sprint speed). For a more fulsome prospect report, please refer to the Jays Centre’s top prospect rankings. From a batted ball perspective, he is a straightaway hitter. Piñango’s pull rate is 32.7%, lower than the 37.4% MLB average. His straightaway contact rate is 43.6%, higher than the MLB average of 37.3%. Regarding opposite field rate, the MLB average is 25.1%, higher than Piñango’s 23.6% mark. He is also a contact hitter, as shown by his 83.7% contact rate (74.7% MLB average) and swings at pitches out of the zone at a 32.0% clip, slightly higher than MLB’s 30.1% average chase rate. Piñango’s strikeout, walk, and whiff rate marks are 17.1%, 5.3% and 19.9%, respectively. Those scores are lower than the corresponding MLB averages (22.1%, 9.3%, and 25.3%). Generating power is an area where Piñango lags the average MLB hitter: his .097 ISO and .099 xISO trail MLB’s average .148 ISO and .155 xISO. There are three reasons why Piñango has produced below-average power numbers. First, his pull rate lags the MLB average. On batted balls pulled, hit straightaway and to the opposite field, the MLB average ISO numbers are .312, .112 and .139, respectively. Piñango’s opportunity to generate ISO is limited due to his below-average amount of pulled contact. The second reason is launch angle. The MLB average launch angle is 13 degrees, whereas Piñango’s is 7 degrees. Consider that, on batted balls with a launch angle between 0 and 10 degrees, the average ISO and xISO are .065 and .071, respectively. Contrast those figures with launch angles between 11 and 15 degrees, on which the average ISO and xISO are .182 and .192, respectively. If Piñango could raise his average launch angle, we should observe higher ISO numbers. The third factor that negatively impacts Piñango’s power numbers is his attack angle/timing. According to the MLB website, attack angle is “in large part a timing metric, as the hitter’s attack angle is constantly changing throughout the course of the swing … When the hitter is behind the pitch with his swing (i.e., too late), he will tend to have a lower attack angle.” The MLB average attack angle is 9 degrees, but Piñango’s is -1 degree. Regarding ideal attack angle rate, his 21.9% is well below the MLB average of 48.8%. For context, the average ISO on batted balls with an attack angle between 5 and 20 degrees is .203. Concerning Piñango’s average attack angle, the MLB average ISO on batted balls with an attack angle between -1 and 4 degrees is .081. Notably, an issue for Piñango is not bat speed, as his average is 73.7 mph, faster than the MLB average of 69.8 mph. Therefore, as he gains MLB experience, if Piñango can generate a higher pull rate, launch angle and attack angle, he should post better power numbers. Now, to the question of whether Piñango should be Buffalo-bound when Barger returns, let us peek at a long-overdue table! SLG wOBA ISO OBP # Rank # Rank # Rank # Rank Lukes 0.357 10 0.309 8 0.071 13 0.328 5 Piñango 0.403 4 0.333 4 0.097 9 0.342 2 Sánchez 0.435 2 0.327 6 0.156 4 0.315 7 Straw 0.349 11 0.300 9 0.108 8 0.312 8 Varsho 0.420 3 0.336 3 0.155 5 0.338 3 Schneider 0.211 13 0.254 12 0.085 11 0.295 9 Sosa 0.286 12 0.214 13 0.091 10 0.203 13 MLB Average 0.387 0.316 0.148 0.318 Higher than MLB Average: Source: Baseball Savant. Data is as of May 25. The metrics I selected for the table are those with the highest correlation with scoring runs. In a prior article, I calculated regression results for the last 11 162-game regular seasons (2013-2019 and 2021-2024) with various metrics and runs. Why the focus on runs? Toronto ranks 22nd in runs per game as of May 25. Concerning the decision to make room for Barger, one of the factors the Blue Jays should consider is a player’s performance in metrics that lead to run scoring. As shown in the table, Piñango’s SLG, wOBA and OBP are better than the MLB average. Furthermore, his SLG, wOBA and OBP rankings among the 2026 Blue Jays with at least 50 plate appearances are fourth, fourth and second, respectively. His xSLG, xwOBA, and xOBP numbers are marginally below the corresponding MLB averages. Accordingly, except for ISO, Piñango’s metrics that are strongly correlated with run-scoring scream, “No Buffalo for the rookie!” However, there are other issues to consider. The table demonstrates that Piñango has generated better numbers than Lenyn Sosa. However, if Toronto removed Sosa from the 26-man roster instead of Piñango, Sosa would have to clear waivers because he has no MiLB options remaining. Given that Sosa has been awful (32 wRC+), losing him to waivers would not be catastrophic, to say the least. Nevertheless, the primary concern is that Sosa is Toronto’s only backup middle infielder. If the Blue Jays add Barger, keep Piñango and cut ties with Sosa, Toronto will have six outfielders (Piñango, Barger, Nathan Lukes, Daulton Varsho, Jesús Sánchez, and Myles Straw). Who would play second base or shortstop if Andrés Giménez or Ernie Clement were not available? Therefore, Toronto needs a backup middle infielder, but it does not need to be Sosa. Perhaps Davis Schneider can rebound after his stint in Buffalo, or a Buffalo Bison (Josh Kasevich) can replace Sosa. Of course, there is always the possibility that Toronto could add a middle infielder from the trade market. Lastly, a topic for another day is the batter-handedness of Toronto’s outfielders. Of the six, including Piñango, only one (Straw) is a right-handed batter. As of May 25, Toronto’s outfielders have a 65 wRC+ versus left-handed pitchers, which ranks 24th. Against right-handed pitchers, the Blue Jays’ outfielders have posted a 109 wRC+, good for ninth-best. At some point this season, Toronto’s management should add a lefty-masher to the outfield mix. What does this mean for Piñango when Barger returns? Unfortunately, he appears to be the one who would be Buffalo-bound. Suppose Toronto wants to carry 13 pitchers on the 26-man roster. Accordingly, there will be eight slots occupied by non-outfielders: four infielders, two catchers, one designated hitter, and one middle infielder. Hence, Toronto will deploy five outfielders. Barger, Sánchez, and Varsho should remain because they offer the power that the team needs. Lukes and Straw offer flexibility because they can play more than one outfield position well. The three primary strikes against Piñango remaining on the 26-man roster are his below-average power (ISO), his left-handed bat for a team with a surplus of left-handed-hitting outfielders, and his recent defensive woes. Hence, the game of roster musical chairs leaves Piñango standing (in Buffalo). The Last Word Piñango has had a particularly good season thus far. Since joining the big league club in April, he has produced a 112 wRC+ and a 0.4 fWAR. However, with Barger's imminent return, Toronto will have one too many outfielders, and Piñango will likely be Buffalo-bound.
On July 27, 2024, the Blue Jays acquired Yohendrick Piñango and Josh Rivera from the Cubs in exchange for Nate Pearson. Last season, Piñango posted a 124 wRC+ with the Buffalo Bisons. However, Toronto left him off the 40-man roster before the Rule 5 draft. Fortunately for the Blue Jays, another team did not select him. Let us take a deeper dive into Piñango’s numbers. Since Piñango made his MLB debut on April 26, he has been one of the Blue Jays’ better hitters. As of May 25, his .342 OBP ranked second on the team, and his .333 wOBA and .403 SLG were the team's fourth-highest. In the field, many scouts considered his defence to be below average. Entering the May 25 game, Piñango had a 1 OAA and 0 FRV in limited innings (144). However, that evening, he misplayed two very makeable catches, which are not reflected in those OAA and FRV numbers. Also, he is not fleet of foot (44th percentile in sprint speed). For a more fulsome prospect report, please refer to the Jays Centre’s top prospect rankings. From a batted ball perspective, he is a straightaway hitter. Piñango’s pull rate is 32.7%, lower than the 37.4% MLB average. His straightaway contact rate is 43.6%, higher than the MLB average of 37.3%. Regarding opposite field rate, the MLB average is 25.1%, higher than Piñango’s 23.6% mark. He is also a contact hitter, as shown by his 83.7% contact rate (74.7% MLB average) and swings at pitches out of the zone at a 32.0% clip, slightly higher than MLB’s 30.1% average chase rate. Piñango’s strikeout, walk, and whiff rate marks are 17.1%, 5.3% and 19.9%, respectively. Those scores are lower than the corresponding MLB averages (22.1%, 9.3%, and 25.3%). Generating power is an area where Piñango lags the average MLB hitter: his .097 ISO and .099 xISO trail MLB’s average .148 ISO and .155 xISO. There are three reasons why Piñango has produced below-average power numbers. First, his pull rate lags the MLB average. On batted balls pulled, hit straightaway and to the opposite field, the MLB average ISO numbers are .312, .112 and .139, respectively. Piñango’s opportunity to generate ISO is limited due to his below-average amount of pulled contact. The second reason is launch angle. The MLB average launch angle is 13 degrees, whereas Piñango’s is 7 degrees. Consider that, on batted balls with a launch angle between 0 and 10 degrees, the average ISO and xISO are .065 and .071, respectively. Contrast those figures with launch angles between 11 and 15 degrees, on which the average ISO and xISO are .182 and .192, respectively. If Piñango could raise his average launch angle, we should observe higher ISO numbers. The third factor that negatively impacts Piñango’s power numbers is his attack angle/timing. According to the MLB website, attack angle is “in large part a timing metric, as the hitter’s attack angle is constantly changing throughout the course of the swing … When the hitter is behind the pitch with his swing (i.e., too late), he will tend to have a lower attack angle.” The MLB average attack angle is 9 degrees, but Piñango’s is -1 degree. Regarding ideal attack angle rate, his 21.9% is well below the MLB average of 48.8%. For context, the average ISO on batted balls with an attack angle between 5 and 20 degrees is .203. Concerning Piñango’s average attack angle, the MLB average ISO on batted balls with an attack angle between -1 and 4 degrees is .081. Notably, an issue for Piñango is not bat speed, as his average is 73.7 mph, faster than the MLB average of 69.8 mph. Therefore, as he gains MLB experience, if Piñango can generate a higher pull rate, launch angle and attack angle, he should post better power numbers. Now, to the question of whether Piñango should be Buffalo-bound when Barger returns, let us peek at a long-overdue table! SLG wOBA ISO OBP # Rank # Rank # Rank # Rank Lukes 0.357 10 0.309 8 0.071 13 0.328 5 Piñango 0.403 4 0.333 4 0.097 9 0.342 2 Sánchez 0.435 2 0.327 6 0.156 4 0.315 7 Straw 0.349 11 0.300 9 0.108 8 0.312 8 Varsho 0.420 3 0.336 3 0.155 5 0.338 3 Schneider 0.211 13 0.254 12 0.085 11 0.295 9 Sosa 0.286 12 0.214 13 0.091 10 0.203 13 MLB Average 0.387 0.316 0.148 0.318 Higher than MLB Average: Source: Baseball Savant. Data is as of May 25. The metrics I selected for the table are those with the highest correlation with scoring runs. In a prior article, I calculated regression results for the last 11 162-game regular seasons (2013-2019 and 2021-2024) with various metrics and runs. Why the focus on runs? Toronto ranks 22nd in runs per game as of May 25. Concerning the decision to make room for Barger, one of the factors the Blue Jays should consider is a player’s performance in metrics that lead to run scoring. As shown in the table, Piñango’s SLG, wOBA and OBP are better than the MLB average. Furthermore, his SLG, wOBA and OBP rankings among the 2026 Blue Jays with at least 50 plate appearances are fourth, fourth and second, respectively. His xSLG, xwOBA, and xOBP numbers are marginally below the corresponding MLB averages. Accordingly, except for ISO, Piñango’s metrics that are strongly correlated with run-scoring scream, “No Buffalo for the rookie!” However, there are other issues to consider. The table demonstrates that Piñango has generated better numbers than Lenyn Sosa. However, if Toronto removed Sosa from the 26-man roster instead of Piñango, Sosa would have to clear waivers because he has no MiLB options remaining. Given that Sosa has been awful (32 wRC+), losing him to waivers would not be catastrophic, to say the least. Nevertheless, the primary concern is that Sosa is Toronto’s only backup middle infielder. If the Blue Jays add Barger, keep Piñango and cut ties with Sosa, Toronto will have six outfielders (Piñango, Barger, Nathan Lukes, Daulton Varsho, Jesús Sánchez, and Myles Straw). Who would play second base or shortstop if Andrés Giménez or Ernie Clement were not available? Therefore, Toronto needs a backup middle infielder, but it does not need to be Sosa. Perhaps Davis Schneider can rebound after his stint in Buffalo, or a Buffalo Bison (Josh Kasevich) can replace Sosa. Of course, there is always the possibility that Toronto could add a middle infielder from the trade market. Lastly, a topic for another day is the batter-handedness of Toronto’s outfielders. Of the six, including Piñango, only one (Straw) is a right-handed batter. As of May 25, Toronto’s outfielders have a 65 wRC+ versus left-handed pitchers, which ranks 24th. Against right-handed pitchers, the Blue Jays’ outfielders have posted a 109 wRC+, good for ninth-best. At some point this season, Toronto’s management should add a lefty-masher to the outfield mix. What does this mean for Piñango when Barger returns? Unfortunately, he appears to be the one who would be Buffalo-bound. Suppose Toronto wants to carry 13 pitchers on the 26-man roster. Accordingly, there will be eight slots occupied by non-outfielders: four infielders, two catchers, one designated hitter, and one middle infielder. Hence, Toronto will deploy five outfielders. Barger, Sánchez, and Varsho should remain because they offer the power that the team needs. Lukes and Straw offer flexibility because they can play more than one outfield position well. The three primary strikes against Piñango remaining on the 26-man roster are his below-average power (ISO), his left-handed bat for a team with a surplus of left-handed-hitting outfielders, and his recent defensive woes. Hence, the game of roster musical chairs leaves Piñango standing (in Buffalo). The Last Word Piñango has had a particularly good season thus far. Since joining the big league club in April, he has produced a 112 wRC+ and a 0.4 fWAR. However, with Barger's imminent return, Toronto will have one too many outfielders, and Piñango will likely be Buffalo-bound. -
.jpg.97d64c1b98e7d600951d5ee04f9afe10.jpg) Before the 2026 season, Jesús Sánchez generated a .181 ISO in his six-year MLB career. That ISO ranks in the 66th percentile among the 382 hitters with at least 1,000 plate appearances during that period. Accordingly, it is easy to understand why the Blue Jays would be interested in Sánchez’s power. Despite his history, Sánchez has not delivered the expected power so far this season. After the May 10 game against the Angels, his ISO was .157, above the .148 MLB average. However, that .157 includes his home run when he faced second baseman, Adam Frazier, who entered the May 9 game in the eighth inning as a fill-in pitcher for the Angels with Toronto holding a 10-1 lead. Before May 9, Sánchez's ISO was .140, which was below expectations. Overall, his 2026 wRC+ is 87, but his .318 xwOBA corresponds with a 100 wRC+. Therefore, it appears that Lady Luck has not looked favourably upon Sánchez thus far this season. Could luck be a factor that explains the ISO drop from the pre-2026 version of Sánchez? No, there are other aspects to consider, which are as follows: Chasing Contact Sprint Speed Bat Tracking The best way to address Sánchez’s power loss is to lay out the data all at once. Yes, table time! In fact, two tables! Table 1 shows the ISO (SLG minus BA) and xISO (xSLG minus xBA) for Sánchez for 2026 and for the 2023-2025 period, in total and by zone. The shadow zone is the width of two baseballs: one baseball lies in the strike zone, and one baseball is outside. Also, observe that Sánchez’s xISO has consistently exceeded his ISO, suggesting that perhaps Lady Luck (a positive xISO-ISO delta) does not explain the 2026 ISO underperformance. Table 2 displays his swing rate and chase rate by attack zone. Now to the analysis! Table 1 All Zones In-Zone Out-of-Zone Heart Zone Shadow Zone Chase Zone xISO Sánchez - 2026 0.169 0.202 0.113 0.163 0.215 0.059 Sánchez - 2023 to 2025 0.211 0.291 0.044 0.373 0.133 0.030 MLB - 2023 to 2025 0.167 0.210 0.053 0.258 0.117 0.023 ISO Sánchez - 2026 0.157 0.158 0.156 0.093 0.207 0.176 Sánchez - 2023 to 2025 0.172 0.231 0.048 0.294 0.112 0.039 MLB - 2023 to 2025 0.159 0.198 0.056 0.241 0.116 0.026 Source: Baseball Savant. Sánchez's 2026 data is as of May 10. Table 2 Swing% Contact% Heart Shadow Chase Waste Heart Shadow Chase Waste Sánchez - 2026 76.9 64.9 36.0 12.8 84.3 81.5 69.4 0.0 Sánchez - 2023 to 2025 76.6 56.1 27.6 12.1 86.3 73.5 44.6 8.6 MLB - 2023 to 2025 75.8 57.0 27.3 10.8 86.5 73.4 45.8 7.2 MLB ISO - 2023 to 2025 0.241 0.116 0.026 0.001 Source: Baseball Savant. Sánchez's 2026 data is as of May 5. Chasing Contact Sánchez has increased both the rate at which he swings at pitches and the rate at which he makes contact this season compared to the 2023-2025 period. Overall, his 2026 swing rate and contact rate are 54.5% and 77.6%, respectively, which are higher than his 50.5% swing rate and 73.1% contact rate during the 2023-2025 period. One of the benefits of a higher contact rate is a lower K%: Sánchez’s 2026 strikeout rate is 20.3%, lower than his 2023-2025 24.9% strikeout rate. Unsurprisingly, the higher swing rate and contact rate this season have led to a lower walk rate (4.5%) than during the 2023-2025 seasons (8.4%). Furthermore, Sánchez’s average 2026 bat speed is 73.0 mph (62nd percentile), which is slower than his 2025 mark of 75.9 mph (93rd percentile). A reduced bat speed is consistent with a batter who wants to increase his contact rate. However, the higher swing rate and contact rate have resulted in lower ISO and xISO numbers. As Table 2 shows, his swing rates have risen in the non-power zones: shadow, chase, and waste. Under the Contact% numbers, note the average ISO numbers for the four zones. On average, hitters generate more power on pitches in the heart zone than in the shadow, chase, and waste zones. From a contact perspective, the higher contact rates in the shadow and chase zones have contributed to Sánchez’s 2026 power decline. To illustrate this point, I recalculated Sánchez’s 2026 ISO and xISO using his 2023-2025 swing rates and his 2026 contact rates. Also, I held the total number of swings in 2026 constant and applied the relevant 2026 ISO/xISO per-swing numbers. In other words, based on the swing-rate differences between the 2023-2025 seasons and 2026, I transferred 18 swings from the waste, the chase, and the outer part of the shadow zone to the heart zone and the inner part of the shadow zone. I performed a similar transfer from the out-of-zone swings to the in-zone swings. The results of the calculation are not surprising. If Sánchez had his 2023-2025 swing rates, combined with his 2026 contact rates, his 2026 ISO would be .160, instead of .157. His 2026 xISO would rise from .169 to .182. As a check, I performed the same calculation using the gameday zones (in and out of the strike zone), and the results were identical (.160 ISO and .182 xISO). In summary, part of the reason Sánchez’s ISO and xISO numbers are below his 2023-2025 marks is that he is swinging too much and making more contact in the non-power zones (shadow, chase, and waste). Sprint Speed The second piece of the puzzle. Extra-base hits include doubles, triples, and home runs. Given that Sánchez has averaged less than two triples per season, he is not a triples threat. Accordingly, I will focus on home runs and doubles. So far in 2026, Sánchez has hit a home run every 24.2 at-bats, better than he did during the 2023-2025 period (every 28.3 at-bats). The MLB average from 2023 to 2025 was one homer every 29.0 at-bats. Historically, Sánchez has hit a home run at a slightly faster pace than the MLB average. Therefore, his power decline is reflected in his doubles. His at-bats divided by doubles rates are 15.7, 19.6 and 21.5 in 2023, 2024, and 2025, respectively. The 2023-2025 MLB average is 18.8 at-bats per double. Thus far in 2026, Sánchez’s doubles rate is one double every 30.3 at-bats. One reason his doubles rate has declined could be his diminished foot speed. His sprint speed percentile rankings are 54th, 46th, 40th, and 18th in 2023, 2024, 2025, and 2026, respectively. Because foot speed and hitting with power contribute to producing doubles, Sánchez’s sprint speed decline could be a reason his rate of hitting doubles has dropped. Bat Tracking A barreled ball is determined by a combination of exit velocity and launch angle. During the 2023-2025 period, Sánchez had above-average barrel rates, both in barrels/BBE (batted ball event) and in barrels/PA (plate appearance). Thus far in 2026, his barrels/BBE rate is 7.2%, down from 11.8% during 2023-2025. The MLB average is 8.2%. Concerning his barrels/PA rate, he posted a 7.8% in 2023-2025, higher than 2026’s 5.3%. The MLB average was 5.5%. What is going on? It is not the 98-mph exit velocity requirement for a batted ball. Concerning batted balls meeting the 98 mph or faster requirement, Sánchez’s 2026 rate (37%) is similar to his 2023-2025 rate (39%). Therefore, the reduced 2026 barrel rates must be due to a lower rate of batted balls that meet the launch angle requirement. What could explain the lower rate of required launch angle on batted balls that would otherwise be barreled balls? It could be a notable change in Sánchez’s ideal attack angle, but his 2026 overall ideal attack angle rate is 48.9%, a tick lower than his 49.1% rate during the 2023-2025 period. Given that there is only a minor change in this area, Sánchez’s underlying swing mechanics do not explain the reduced barrel rates. Unfortunately, I do not have any insights into the reduced barrel rates beyond the issue of small sample size, which is a legitimate explanation. Thus far in 2026, Sánchez has barreled seven pitches out of 97 batted ball events. If he had four more barreled balls, his 2026 barrel rates would be like those of the 2023-2025 period. Do not despair. The small sample is a positive indicator. Given Sánchez’s ideal attack angle history and his above-average exit velocity record, he should start to barrel balls at a rate consistent with the 2023-2025 period. The Last Word Before joining the Toronto Blue Jays, Jesús Sánchez was a hitter with above-average power. However, thus far this season, his power production has been below expectations. Many factors help explain Sánchez’s reduced power numbers. The primary reason is higher swing and contact rates in zones that typically produce lower power numbers (for example, the shadow and chase zones). Another cause is a decline in foot speed. The final factor is the small size of the sample. Hence, for the balance of the 2026 season, with more plate discipline (by chasing less) and a regression to his historical barrel rates and bat tracking metrics, Sánchez should return to his previous status as the power hitter the Blue Jays thought they were acquiring before this season began.
Before the 2026 season, Jesús Sánchez generated a .181 ISO in his six-year MLB career. That ISO ranks in the 66th percentile among the 382 hitters with at least 1,000 plate appearances during that period. Accordingly, it is easy to understand why the Blue Jays would be interested in Sánchez’s power. Despite his history, Sánchez has not delivered the expected power so far this season. After the May 10 game against the Angels, his ISO was .157, above the .148 MLB average. However, that .157 includes his home run when he faced second baseman, Adam Frazier, who entered the May 9 game in the eighth inning as a fill-in pitcher for the Angels with Toronto holding a 10-1 lead. Before May 9, Sánchez's ISO was .140, which was below expectations. Overall, his 2026 wRC+ is 87, but his .318 xwOBA corresponds with a 100 wRC+. Therefore, it appears that Lady Luck has not looked favourably upon Sánchez thus far this season. Could luck be a factor that explains the ISO drop from the pre-2026 version of Sánchez? No, there are other aspects to consider, which are as follows: Chasing Contact Sprint Speed Bat Tracking The best way to address Sánchez’s power loss is to lay out the data all at once. Yes, table time! In fact, two tables! Table 1 shows the ISO (SLG minus BA) and xISO (xSLG minus xBA) for Sánchez for 2026 and for the 2023-2025 period, in total and by zone. The shadow zone is the width of two baseballs: one baseball lies in the strike zone, and one baseball is outside. Also, observe that Sánchez’s xISO has consistently exceeded his ISO, suggesting that perhaps Lady Luck (a positive xISO-ISO delta) does not explain the 2026 ISO underperformance. Table 2 displays his swing rate and chase rate by attack zone. Now to the analysis! Table 1 All Zones In-Zone Out-of-Zone Heart Zone Shadow Zone Chase Zone xISO Sánchez - 2026 0.169 0.202 0.113 0.163 0.215 0.059 Sánchez - 2023 to 2025 0.211 0.291 0.044 0.373 0.133 0.030 MLB - 2023 to 2025 0.167 0.210 0.053 0.258 0.117 0.023 ISO Sánchez - 2026 0.157 0.158 0.156 0.093 0.207 0.176 Sánchez - 2023 to 2025 0.172 0.231 0.048 0.294 0.112 0.039 MLB - 2023 to 2025 0.159 0.198 0.056 0.241 0.116 0.026 Source: Baseball Savant. Sánchez's 2026 data is as of May 10. Table 2 Swing% Contact% Heart Shadow Chase Waste Heart Shadow Chase Waste Sánchez - 2026 76.9 64.9 36.0 12.8 84.3 81.5 69.4 0.0 Sánchez - 2023 to 2025 76.6 56.1 27.6 12.1 86.3 73.5 44.6 8.6 MLB - 2023 to 2025 75.8 57.0 27.3 10.8 86.5 73.4 45.8 7.2 MLB ISO - 2023 to 2025 0.241 0.116 0.026 0.001 Source: Baseball Savant. Sánchez's 2026 data is as of May 5. Chasing Contact Sánchez has increased both the rate at which he swings at pitches and the rate at which he makes contact this season compared to the 2023-2025 period. Overall, his 2026 swing rate and contact rate are 54.5% and 77.6%, respectively, which are higher than his 50.5% swing rate and 73.1% contact rate during the 2023-2025 period. One of the benefits of a higher contact rate is a lower K%: Sánchez’s 2026 strikeout rate is 20.3%, lower than his 2023-2025 24.9% strikeout rate. Unsurprisingly, the higher swing rate and contact rate this season have led to a lower walk rate (4.5%) than during the 2023-2025 seasons (8.4%). Furthermore, Sánchez’s average 2026 bat speed is 73.0 mph (62nd percentile), which is slower than his 2025 mark of 75.9 mph (93rd percentile). A reduced bat speed is consistent with a batter who wants to increase his contact rate. However, the higher swing rate and contact rate have resulted in lower ISO and xISO numbers. As Table 2 shows, his swing rates have risen in the non-power zones: shadow, chase, and waste. Under the Contact% numbers, note the average ISO numbers for the four zones. On average, hitters generate more power on pitches in the heart zone than in the shadow, chase, and waste zones. From a contact perspective, the higher contact rates in the shadow and chase zones have contributed to Sánchez’s 2026 power decline. To illustrate this point, I recalculated Sánchez’s 2026 ISO and xISO using his 2023-2025 swing rates and his 2026 contact rates. Also, I held the total number of swings in 2026 constant and applied the relevant 2026 ISO/xISO per-swing numbers. In other words, based on the swing-rate differences between the 2023-2025 seasons and 2026, I transferred 18 swings from the waste, the chase, and the outer part of the shadow zone to the heart zone and the inner part of the shadow zone. I performed a similar transfer from the out-of-zone swings to the in-zone swings. The results of the calculation are not surprising. If Sánchez had his 2023-2025 swing rates, combined with his 2026 contact rates, his 2026 ISO would be .160, instead of .157. His 2026 xISO would rise from .169 to .182. As a check, I performed the same calculation using the gameday zones (in and out of the strike zone), and the results were identical (.160 ISO and .182 xISO). In summary, part of the reason Sánchez’s ISO and xISO numbers are below his 2023-2025 marks is that he is swinging too much and making more contact in the non-power zones (shadow, chase, and waste). Sprint Speed The second piece of the puzzle. Extra-base hits include doubles, triples, and home runs. Given that Sánchez has averaged less than two triples per season, he is not a triples threat. Accordingly, I will focus on home runs and doubles. So far in 2026, Sánchez has hit a home run every 24.2 at-bats, better than he did during the 2023-2025 period (every 28.3 at-bats). The MLB average from 2023 to 2025 was one homer every 29.0 at-bats. Historically, Sánchez has hit a home run at a slightly faster pace than the MLB average. Therefore, his power decline is reflected in his doubles. His at-bats divided by doubles rates are 15.7, 19.6 and 21.5 in 2023, 2024, and 2025, respectively. The 2023-2025 MLB average is 18.8 at-bats per double. Thus far in 2026, Sánchez’s doubles rate is one double every 30.3 at-bats. One reason his doubles rate has declined could be his diminished foot speed. His sprint speed percentile rankings are 54th, 46th, 40th, and 18th in 2023, 2024, 2025, and 2026, respectively. Because foot speed and hitting with power contribute to producing doubles, Sánchez’s sprint speed decline could be a reason his rate of hitting doubles has dropped. Bat Tracking A barreled ball is determined by a combination of exit velocity and launch angle. During the 2023-2025 period, Sánchez had above-average barrel rates, both in barrels/BBE (batted ball event) and in barrels/PA (plate appearance). Thus far in 2026, his barrels/BBE rate is 7.2%, down from 11.8% during 2023-2025. The MLB average is 8.2%. Concerning his barrels/PA rate, he posted a 7.8% in 2023-2025, higher than 2026’s 5.3%. The MLB average was 5.5%. What is going on? It is not the 98-mph exit velocity requirement for a batted ball. Concerning batted balls meeting the 98 mph or faster requirement, Sánchez’s 2026 rate (37%) is similar to his 2023-2025 rate (39%). Therefore, the reduced 2026 barrel rates must be due to a lower rate of batted balls that meet the launch angle requirement. What could explain the lower rate of required launch angle on batted balls that would otherwise be barreled balls? It could be a notable change in Sánchez’s ideal attack angle, but his 2026 overall ideal attack angle rate is 48.9%, a tick lower than his 49.1% rate during the 2023-2025 period. Given that there is only a minor change in this area, Sánchez’s underlying swing mechanics do not explain the reduced barrel rates. Unfortunately, I do not have any insights into the reduced barrel rates beyond the issue of small sample size, which is a legitimate explanation. Thus far in 2026, Sánchez has barreled seven pitches out of 97 batted ball events. If he had four more barreled balls, his 2026 barrel rates would be like those of the 2023-2025 period. Do not despair. The small sample is a positive indicator. Given Sánchez’s ideal attack angle history and his above-average exit velocity record, he should start to barrel balls at a rate consistent with the 2023-2025 period. The Last Word Before joining the Toronto Blue Jays, Jesús Sánchez was a hitter with above-average power. However, thus far this season, his power production has been below expectations. Many factors help explain Sánchez’s reduced power numbers. The primary reason is higher swing and contact rates in zones that typically produce lower power numbers (for example, the shadow and chase zones). Another cause is a decline in foot speed. The final factor is the small size of the sample. Hence, for the balance of the 2026 season, with more plate discipline (by chasing less) and a regression to his historical barrel rates and bat tracking metrics, Sánchez should return to his previous status as the power hitter the Blue Jays thought they were acquiring before this season began. -
Before the 2026 season, Jesús Sánchez generated a 0.181 ISO in his six-year MLB career. That ISO ranks in the 66th percentile among the 382 hitters with at least 1,000 plate appearances during that period. Accordingly, it is easy to understand why the Blue Jays would be interested in Sánchez’s power. Despite his history, Sánchez has not delivered the expected power so far this season. After the May 5 game against Tampa, Sánchez’s ISO was 0.143, below the 0.150 2026 MLB Average. Overall, his 2026 wRC+ is 78, but his 0.325 xwOBA corresponds with a 105 wRC+. Therefore, it appears that Lady Luck has not looked favourably upon Sánchez thus far this season. Is luck the only factor that explains the ISO drop from the pre-2026 version of Sánchez? No, there are other aspects to consider, which are as follows: Chasing Contact Timing Sprint Speed The best way to address Sánchez’s power loss is to lay out the data all at once. Yes, table time! In fact, three tables! Table 1 shows the ISO (SLG minus BA) and xISO (xSLG minus xBA) for Sánchez for 2026 and the 2023-2025 period by pitch type. Notably, the pitch mix Sánchez has faced in 2026 is like that in prior seasons, as is the pitch location (2026 versus 2025). The first observation from this table is that Sánchez’s xISO has consistently exceeded his ISO, suggesting that perhaps Lady Luck does not explain the 2026 xISO-ISO difference. Second, his 2026 xISO on fastballs and offspeed pitches lags Sánchez’s 2023-2025 numbers. This latter issue will be addressed in the Timing section. Table 2 displays the Swing% and Chase% by attack zone. Lastly, Table 3 shows the ISO and xISO metrics by attack and game-day zones. Now to the analysis! .report-table-wrap{ width:1800px; margin:0 auto 40px auto; font-family:Arial, Helvetica, sans-serif; background:#fff; color:#000; } .report-table{ width:100%; border-collapse:collapse; table-layout:fixed; font-size:28px; text-align:center; } Table 1 All Pitches Fastballs (57.0%) Breaking (24.9%) Offspeed (18.1%) xISO Sánchez 2026 0.174 0.184 0.207 0.057 Sánchez 2023-2025 0.211 0.228 0.223 0.147 MLB 2023-2025 0.167 0.188 0.148 0.133 ISO Sánchez 2026 0.143 0.172 0.154 0.000 Sánchez 2023-2025 0.172 0.189 0.148 0.167 MLB 2023-2025 0.159 0.171 0.153 0.135 Source: Baseball Savant. Sánchez's 2026 data is as of May 5, as are the pitch mix numbers. Table 2 Swing% Contact% Heart Shadow Chase Waste Heart Shadow Chase Waste Sánchez 2026 76.9 64.9 36.0 12.8 84.3 81.5 69.4 0.0 Sánchez 2023-2025 76.6 56.1 27.6 12.1 86.3 73.5 44.6 8.6 MLB 2023-2025 75.8 57.0 27.3 10.8 86.5 73.4 45.8 7.2 MLB ISO 2023-2025 0.241 0.116 0.026 0.001 Source: Baseball Savant. Sánchez's 2026 data is as of May 5. Table 3 In-Zone Out-of- Zone Heart Zone Shadow Zone Chase Zone xISO Sánchez 2026 0.216 0.102 0.179 0.223 0.007 Sánchez 2023-2025 0.291 0.044 0.373 0.133 0.030 MLB 2023-2025 0.210 0.053 0.258 0.117 0.023 ISO Sánchez 2026 0.169 0.098 0.103 0.214 0.000 Sánchez 2023-2025 0.231 0.048 0.294 0.112 0.039 MLB 2023-2025 0.198 0.056 0.241 0.116 0.026 Source: Baseball Savant. Sánchez's 2026 data is as of May 5. Chasing Contact It appears that Sánchez has focused on increasing both the rates at which he swings at pitches and makes contact this season compared to the 2023-2025 period. Overall, his 2026 Swing% and Contact% are 55.8% and 78.7%, respectively, which are higher than his 50.5% Swing% and 73.1% Contact% during the 2023-2025 period. One of the benefits of a higher contact rate is a lower K%: Sánchez’s 2026 K% is 18.7%, lower than the 2023-2025 24.9% strikeout rate. Unsurprisingly, the higher Swing% and Contact% this season have led to a lower walk rate (4.1%) than during the 2023-2025 seasons (8.4%). Furthermore, Sánchez’s average 2026 bat speed is 73.1 mph (64th percentile), which is lower than his 2025 mark of 75.9 mph (93rd percentile). A reduced bat speed is consistent with a batter who wants to increase his contact rate. However, the higher Swing% and Contact% have resulted in lower ISO and xISO numbers. As Table 2 shows, the Swing and Contact rates have risen in the non-power zones: Shadow, Chase, and Waste. Under the Contact% numbers, note the average ISO numbers for the four zones. On average, hitters generate more power on pitches in the Heart Zone than in the Shadow, Chase, and Waste zones. From a contact perspective, the higher Contact% in the Shadow and Chase zones have contributed to Sánchez’s 2026 power decline. To illustrate this point, I recalculated Sánchez’s 2026 ISO and xISO using his 2023-2025 swing rates and his 2026 contact rates. Also, I held the number of 2026 swings constant. In other words, based on the swing-rate differences between the 2023-2025 seasons and 2026, I transferred some swings from the Waste, the Chase, and the outer part of the Shadow Zone to the Heart Zone and the inner part of the Shadow Zone. The results of the calculation are not surprising. If Sánchez had his 2023-2025 swing rates, combined with his 2026 contact rates, his 2026 ISO would be 0.156, instead of 0.143. His 2026 xISO would rise from 0.174 to 0.194. As a check, I performed the same calculation using the Game Day Zones (in and out of the strike zone), and the results were identical (0.156 ISO and 0.194 xISO). In summary, part of the reason Sánchez’s ISO and xISO numbers are below his 2023-2025 marks is that he is swinging too much and making more contact in the non-power zones (Shadow, Chase, and Waste). Timing Concerning batting stance and positioning, Sánchez has made changes in 2026. In 2025, his stance was open, 10 degrees. This season, Sánchez is more open (14 degrees). Also, he has narrowed his stance (distance between feet) from 34.9 inches last season to 29.4 inches in 2026. Hence, in the early stage of stance and positioning changes, a batter’s timing can be affected. How do timing issues affect a batter’s power? One of the new Baseball Savant metrics is Ideal Attack Angle, which is a swing angle that is between 5° and 20°. Why is attack angle important? Because swings “in the ideal attack angle range are much more likely to produce line drives and fly balls, resulting in significantly higher slugging percentage and more extra-base hits.” Furthermore, a “hitter's ideal attack angle rate is the percentage of his competitive swings that fall within the 5-20° attack angle range.” Lastly, the ideal attack angle is “largely reflective of the hitter’s timing.” How has Sánchez’s Ideal Attack Angle percentage changed from the 2023-2025 period? His average Ideal Attack Angle percentage from 2023 to 2025 was 49.1%, below MLB’s 51.0%. In 2026, his Ideal Attack Angle percentage is 46.9%. Accordingly, Sánchez’s lower Ideal Attack Angle percentage in 2026 is consistent with his lower ISO and xISO numbers. Tying everything together, the stance and positioning changes Sánchez has adopted thus far in 2026 may have affected his timing, resulting in a lower Ideal Attack Angle percentage and, thereby, a lower ISO and xISO. Furthermore, timing issues would be consistent with lower xISO on fastballs and offspeed pitches, not to mention, less power generated on batted balls located in the Heart Zone, and the Game Day In-Zone. Phew, that is a lot of tying up! But it makes sense given the data. Sprint Speed The last piece of the puzzle. Extra-base hits include doubles, triples, and home runs. Given that Sánchez has averaged less than two triples per season, he is not a triples threat. Accordingly, I will focus on home runs and doubles. So far in 2026, Sánchez has hit a home run every 28.3 at-bats, the same as he did during the 2023-2025 period. The MLB average from 2023 to 2025 was one homer every 29.0 at-bats. Historically, Sánchez has hit a home run at a slightly faster pace than the MLB average. Therefore, Sánchez’s power decline is reflected in his doubles. His at-bats divided by doubles rates are 15.7, 19.6 and 21.5 in 2023, 2024, and 2025, respectively. The 2023-2025 MLB average is 18.8 at-bats per double. Thus far in 2026, Sánchez’s doubles rate is one double every 28.3 at-bats. One reason his doubles rate has declined could be his diminished foot speed. His Sprint Speed percentile rankings are 54th, 46th, 40th, and 21st in 2023, 2024, 2025, and 2026, respectively. Because foot speed and hitting with power contribute to producing doubles, Sánchez’s Sprint Speed decline could be a reason his rate of hitting doubles has dropped. The Last Word Before joining the Toronto Blue Jays, Sánchez was a hitter with above-average power. However, thus far this season, his power production has been below expectations. Many factors help explain Sánchez’s reduced power numbers. The primary reason is higher swing and contact rates in zones that typically produce lower power numbers (for example, the Shadow and Chase zones). Another cause is an emphasis on contact at the expense of bat speed. The other factors are timing issues caused by changes to batting stance and positioning, and a decline in foot speed. However, despite these issues, Sánchez should be able to adjust, allowing him to be the power hitter the Blue Jays thought they were acquiring before this season began. View full article
-
Jays Centre is taking a close look at every position on the Toronto Blue Jays heading into the 2026 season. Check out prior entries in the series here: Catcher First Base Second Base Shortstop Third Base Left Field Right Field DH Toronto Blue Jays Center Fielders at a Glance Starter: Daulton Varsho Backup: Myles Straw Depth: Nathan Lukes, Jonatan Clase Prospects: RJ Schreck, Jace Bohrofen Blue Jays Center Field fWAR in 2025: 4th out of 30 (4.4) Blue Jays Center Field FGDC Projection for 2026: 12th (3.0) For the 2021-2025 period, Toronto’s fWAR production from center fielders ranks sixth-highest (16.2 fWAR). The best fWAR during these seasons was generated by the Mariners (23.8); the next-closest was the Yankees (22.3). During those seasons, Toronto’s highest ranking was fourth place in 2025; the lowest in 2024 (21st). Overall, exceptional performance. So, what does 2026 look like for Toronto’s center fielders? The Good Oh, yes, there are tables! The first is a summary of FanGraphs Depth Charts' 2026 projection for Toronto’s outfielders. According to Depth Charts’ estimate, Blue Jays center fielders will produce the 12th-highest fWAR among MLB teams. That projected performance lags two of Toronto’s American League East rivals: the Yankees (3.9) and Red Sox (3.7). There are good reasons to believe that Toronto’s center fielders will perform better than the projected 3.0 fWAR. More on this later. 2026 Projected fWAR LF RF CF OF Daulton Varsho 2.7 2.7 Nathan Lukes 0.6 0.4 0.2 1.2 Myles Straw - - 0.1 0.1 Jesús Sánchez 1.2 0.2 1.4 Addison Barger 1.0 1.0 Davis Schneider 0.4 0.4 George Springer 0.1 0.6 0.7 Projected 2026 total 2.4 2.3 3.0 7.7 2025 total 2.6 1.9 4.4 8.9 Toronto's Projected Rank - 2026 11 12 12 14 Toronto's Rank - 2025 13 13 4 7 Source: Depth Charts courtesy of FanGraphs The second table shows the career and 2025 OAA and FRV values for the center fielders. Last season, due to injuries (shoulder and hamstring ailments), Varsho accumulated 550 innings in center field for the Blue Jays. That innings number was 38% of Toronto’s center field total (1,438). Defensively, Straw was superb, as evidenced by his 16 OAA/1200 and 16 FRV/1200 scores. Concerning Lukes, his OAA in center field was -1 in 214 innings, but his FRV was zero because his throwing added one run. Hence, Lukes’ overall center field performance was average. Center Field Innings Center Field OAA Per 1200 Center Field FRV Per 1200 Career 2025 Career 2025 Career 2025 Daulton Varsho 2,375 550 16 20 17 13 Nathan Lukes 246 214 -15 -6 -15 0 Myles Straw 4,695 532 9 16 9 16 Source: FanGraphs Regarding Varsho, his decline in arm strength was an issue in 2025. Consider the next table. Please note that the innings shown for each player reflect innings played at all positions (Baseball Savant does not separate the Arm Value numbers by position). However, the Arm Strength numbers shown in the table concern only center field play. After the 2024 campaign, Varsho underwent shoulder surgery and did not play again until April 29, 2025. Upon his return, it was evident that Varsho’s arm strength, which was below average before 2025, was weaker. His Arm Strength was 83.7 mph in 2024, but averaged 73.7 mph in 2025. Among the 44 center fielders with at least 100 throws, Varsho’s 2025 73.7 mph ranked last. In 2024, his arm strength ranked 50th out of 54 center fielders. Outfield Innings Arm Value Per 1200 Fielder Runs Arm Strength (mph) Career 2025 Career 2025 Daulton Varsho 4,330 550 2 -4 -2 73.7 Nathan Lukes 1,150 909 6 5 4 87.0 Myles Straw 4,931 698 0 0 0 82.9 MLB Center Fielder Average 89.6 Source: FanGraphs & Baseball Savant More Good In 2025, Toronto batters had 6,180 plate appearances, 1,680 (26%) of which were against left-handed pitchers. Blue Jays’ center fielders produced a 103 wRC+ (ninth-highest) versus lefties. Overall, Toronto’s center fielders posted a 113 wRC+ (fourth-best), including a 116 wRC+ when facing right-handers (MLB’s 10th best). At the player level, when playing center field, the details are as follows: The standout was Lukes, who posted a 141 wRC+, followed by Varsho (125) and Straw (88). Concerning plate appearances when facing left-handed pitchers, Lukes, Varsho, and Straw had plate appearances totals of 10, 55 and 94, respectively. Their wRC+ scores were 132, 101, and 105, respectively. Regarding wRC+ results against right-handed pitchers, Lukes, Varsho, and Straw generated wRC+ scores of 142, 131 and 88, respectively. They produced their wRC+ numbers in 99, 209 and 123 plate appearances, respectively. For the three center fielders, those 2025 wRC+ numbers are noticeably better than their career splits (when playing all positions). Consider the next table. Career Plate Appearances Career wRC+ LHP RHP Total LHP RHP Overall Daulton Varsho 532 1,855 2,387 90 101 99 Nathan Lukes 72 488 560 83 109 106 Myles Straw 707 1,572 2,279 74 83 80 Source: FanGraphs Let’s look on the bright side. It would be nice if Lukes and Straw replicated their 2025 wRC+ numbers this upcoming season. However, the critical center field bat for the Blue Jays is Varsho. Suppose we are witnessing the emergence of Varsho as an above-average MLB hitter. Before 2025, Varsho generated career wOBA, xwOBA and wRC+ scores of .308, .295 and 96, respectively. In 2025, he produced a .345 wOBA, .327 xwOBA and 123 wRC+. The Depth Charts projected fWAR includes a .315 wOBA for Varsho (in 2025, the MLB average wOBA was .313). Suppose the new Varsho produces a .327 wOBA (his 2025 xwOBA) in 2026; his fWAR estimate rises from 2.7 to 3.2. Furthermore, the Depth Charts' 2.7 fWAR figure includes a 4.5 Def for Varsho. Suppose Varsho plays 1,220 innings in center field in 2026, which corresponds to a 2.0 Positional Adjustment. Accordingly, Varsho’s projected Fielding Runs number is 2.5 (4.5 Def less 2.0 positional adjustment). That Fielding Runs number seems low. In 2025, Varsho’s Fielding Runs figure was 3.9 in 550 innings. In 2024 and 2023, his Fielding Runs were 13.7 and 11.4, respectively. If Varsho’s 2026 Fielding Runs are, for example, 10.0, his projected 2026 fWAR increases from 2.7 to 3.5. Together with the estimated 0.5 fWAR bump from the .327 wOBA, Varsho’s 2026 fWAR would be 4.0 (all other things being equal). Suppose Varsho’s 2026 fWAR is 4.0. Toronto’s estimated total center field fWAR rises from 3.0 to 4.3. A 4.3 fWAR would move the Blue Jays’ center field group back up to the fourth-highest fWAR ranking, which it held in 2025. The Bad The key to Toronto’s 2026 center field success is Varsho. If his arm strength does not return to its 2024 level, Varsho’s defensive production will suffer. Furthermore, if Varsho does not remain a very good MLB hitter this season, as he was in 2025, Toronto’s center field crew will underperform at the plate. The Last Word FanGraphs Depth Charts' 2026 center field projection places Toronto at 12th (3.0 fWAR), which lags the team's fourth-best ranking from 2025. I believe the FGDC estimate is on the low side. If Varsho plays a full season and replicates his 2025 hitting and fielding performance, the Blue Jays should have one of the top center field crews in MLB. Defence, particularly with Varsho and Straw, should be elite. The critical question is whether their bats can excel like they did last season. View full article
-
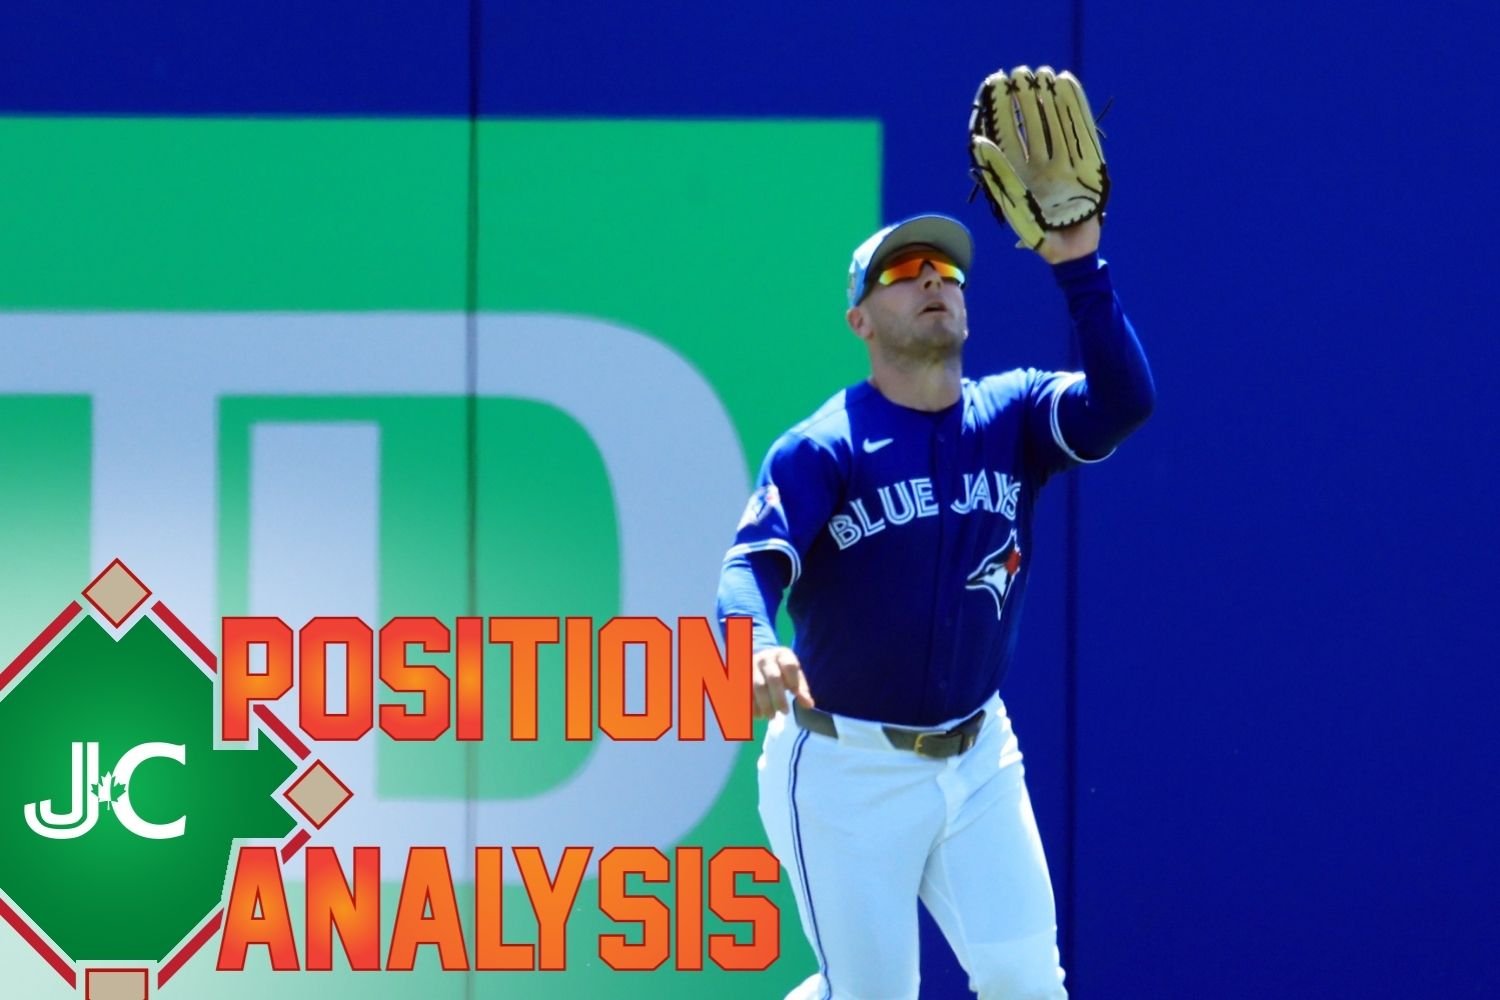 Jays Centre is taking a close look at every position on the Toronto Blue Jays heading into the 2026 season. Check out prior entries in the series here: Catcher First Base Second Base Shortstop Third Base Left Field Right Field DH Toronto Blue Jays Center Fielders at a Glance Starter: Daulton Varsho Backup: Myles Straw Depth: Nathan Lukes, Jonatan Clase Prospects: RJ Schreck, Jace Bohrofen Blue Jays Center Field fWAR in 2025: 4th out of 30 (4.4) Blue Jays Center Field FGDC Projection for 2026: 12th (3.0) For the 2021-2025 period, Toronto’s fWAR production from center fielders ranks sixth-highest (16.2 fWAR). The best fWAR during these seasons was generated by the Mariners (23.8); the next-closest was the Yankees (22.3). During those seasons, Toronto’s highest ranking was fourth place in 2025; the lowest in 2024 (21st). Overall, exceptional performance. So, what does 2026 look like for Toronto’s center fielders? The Good Oh, yes, there are tables! The first is a summary of FanGraphs Depth Charts' 2026 projection for Toronto’s outfielders. According to Depth Charts’ estimate, Blue Jays center fielders will produce the 12th-highest fWAR among MLB teams. That projected performance lags two of Toronto’s American League East rivals: the Yankees (3.9) and Red Sox (3.7). There are good reasons to believe that Toronto’s center fielders will perform better than the projected 3.0 fWAR. More on this later. 2026 Projected fWAR LF RF CF OF Daulton Varsho 2.7 2.7 Nathan Lukes 0.6 0.4 0.2 1.2 Myles Straw - - 0.1 0.1 Jesús Sánchez 1.2 0.2 1.4 Addison Barger 1.0 1.0 Davis Schneider 0.4 0.4 George Springer 0.1 0.6 0.7 Projected 2026 total 2.4 2.3 3.0 7.7 2025 total 2.6 1.9 4.4 8.9 Toronto's Projected Rank - 2026 11 12 12 14 Toronto's Rank - 2025 13 13 4 7 Source: Depth Charts courtesy of FanGraphs The second table shows the career and 2025 OAA and FRV values for the center fielders. Last season, due to injuries (shoulder and hamstring ailments), Varsho accumulated 550 innings in center field for the Blue Jays. That innings number was 38% of Toronto’s center field total (1,438). Defensively, Straw was superb, as evidenced by his 16 OAA/1200 and 16 FRV/1200 scores. Concerning Lukes, his OAA in center field was -1 in 214 innings, but his FRV was zero because his throwing added one run. Hence, Lukes’ overall center field performance was average. Center Field Innings Center Field OAA Per 1200 Center Field FRV Per 1200 Career 2025 Career 2025 Career 2025 Daulton Varsho 2,375 550 16 20 17 13 Nathan Lukes 246 214 -15 -6 -15 0 Myles Straw 4,695 532 9 16 9 16 Source: FanGraphs Regarding Varsho, his decline in arm strength was an issue in 2025. Consider the next table. Please note that the innings shown for each player reflect innings played at all positions (Baseball Savant does not separate the Arm Value numbers by position). However, the Arm Strength numbers shown in the table concern only center field play. After the 2024 campaign, Varsho underwent shoulder surgery and did not play again until April 29, 2025. Upon his return, it was evident that Varsho’s arm strength, which was below average before 2025, was weaker. His Arm Strength was 83.7 mph in 2024, but averaged 73.7 mph in 2025. Among the 44 center fielders with at least 100 throws, Varsho’s 2025 73.7 mph ranked last. In 2024, his arm strength ranked 50th out of 54 center fielders. Outfield Innings Arm Value Per 1200 Fielder Runs Arm Strength (mph) Career 2025 Career 2025 Daulton Varsho 4,330 550 2 -4 -2 73.7 Nathan Lukes 1,150 909 6 5 4 87.0 Myles Straw 4,931 698 0 0 0 82.9 MLB Center Fielder Average 89.6 Source: FanGraphs & Baseball Savant More Good In 2025, Toronto batters had 6,180 plate appearances, 1,680 (26%) of which were against left-handed pitchers. Blue Jays’ center fielders produced a 103 wRC+ (ninth-highest) versus lefties. Overall, Toronto’s center fielders posted a 113 wRC+ (fourth-best), including a 116 wRC+ when facing right-handers (MLB’s 10th best). At the player level, when playing center field, the details are as follows: The standout was Lukes, who posted a 141 wRC+, followed by Varsho (125) and Straw (88). Concerning plate appearances when facing left-handed pitchers, Lukes, Varsho, and Straw had plate appearances totals of 10, 55 and 94, respectively. Their wRC+ scores were 132, 101, and 105, respectively. Regarding wRC+ results against right-handed pitchers, Lukes, Varsho, and Straw generated wRC+ scores of 142, 131 and 88, respectively. They produced their wRC+ numbers in 99, 209 and 123 plate appearances, respectively. For the three center fielders, those 2025 wRC+ numbers are noticeably better than their career splits (when playing all positions). Consider the next table. Career Plate Appearances Career wRC+ LHP RHP Total LHP RHP Overall Daulton Varsho 532 1,855 2,387 90 101 99 Nathan Lukes 72 488 560 83 109 106 Myles Straw 707 1,572 2,279 74 83 80 Source: FanGraphs Let’s look on the bright side. It would be nice if Lukes and Straw replicated their 2025 wRC+ numbers this upcoming season. However, the critical center field bat for the Blue Jays is Varsho. Suppose we are witnessing the emergence of Varsho as an above-average MLB hitter. Before 2025, Varsho generated career wOBA, xwOBA and wRC+ scores of .308, .295 and 96, respectively. In 2025, he produced a .345 wOBA, .327 xwOBA and 123 wRC+. The Depth Charts projected fWAR includes a .315 wOBA for Varsho (in 2025, the MLB average wOBA was .313). Suppose the new Varsho produces a .327 wOBA (his 2025 xwOBA) in 2026; his fWAR estimate rises from 2.7 to 3.2. Furthermore, the Depth Charts' 2.7 fWAR figure includes a 4.5 Def for Varsho. Suppose Varsho plays 1,220 innings in center field in 2026, which corresponds to a 2.0 Positional Adjustment. Accordingly, Varsho’s projected Fielding Runs number is 2.5 (4.5 Def less 2.0 positional adjustment). That Fielding Runs number seems low. In 2025, Varsho’s Fielding Runs figure was 3.9 in 550 innings. In 2024 and 2023, his Fielding Runs were 13.7 and 11.4, respectively. If Varsho’s 2026 Fielding Runs are, for example, 10.0, his projected 2026 fWAR increases from 2.7 to 3.5. Together with the estimated 0.5 fWAR bump from the .327 wOBA, Varsho’s 2026 fWAR would be 4.0 (all other things being equal). Suppose Varsho’s 2026 fWAR is 4.0. Toronto’s estimated total center field fWAR rises from 3.0 to 4.3. A 4.3 fWAR would move the Blue Jays’ center field group back up to the fourth-highest fWAR ranking, which it held in 2025. The Bad The key to Toronto’s 2026 center field success is Varsho. If his arm strength does not return to its 2024 level, Varsho’s defensive production will suffer. Furthermore, if Varsho does not remain a very good MLB hitter this season, as he was in 2025, Toronto’s center field crew will underperform at the plate. The Last Word FanGraphs Depth Charts' 2026 center field projection places Toronto at 12th (3.0 fWAR), which lags the team's fourth-best ranking from 2025. I believe the FGDC estimate is on the low side. If Varsho plays a full season and replicates his 2025 hitting and fielding performance, the Blue Jays should have one of the top center field crews in MLB. Defence, particularly with Varsho and Straw, should be elite. The critical question is whether their bats can excel like they did last season.
 -
Jays Centre is taking a close look at every position on the Toronto Blue Jays heading into the 2026 season. Check out prior entries in the series here: Catcher First Base Second Base Third Base Left Field Toronto Blue Jays Right Fielders at a Glance Starter: Addison Barger Backup: Nathan Lukes Depth: Jesús Sánchez, Myles Straw, George Springer, Jonatan Clase Prospects: Yohendrick Pinango, RJ Schreck Blue Jays Right Field fWAR in 2025: 13th out of 30 (1.9) Blue Jays Right Field FGDC Projection for 2026: 12th (2.3) For the 2021-2025 period, Toronto’s fWAR production from right fielders ranks 13th-highest (11.9 fWAR). The best fWAR during these seasons was from the Yankees (30.5), the next closest was Houston’s 21.1. During those seasons, Toronto’s highest ranking was ninth place in 2021 and 2022; the lowest in 2023 (18th). Overall, cromulent performance. So, what does 2026 look like for Toronto’s right fielders? The Good Oh, yes, there are tables! The first is a summary of the FanGraphs Depth Charts’ 2026 projection for Toronto’s left and right fielders. I also used this table in my left fielder analysis because it shows that manager John Schneider has some flexibility to move corner outfielders between right and left field. This flexibility will be advantageous when constructing the starting lineup and for in-game substitutions. 2026 Projected fWAR LF RF Corner Jesús Sánchez 1.2 0.2 1.4 Addison Barger 1.0 1.0 Davis Schneider 0.4 0.4 Nathan Lukes 0.6 0.4 1.0 George Springer 0.1 0.6 0.7 Myles Straw - - - Projected 2026 Total 2.4 2.3 4.7 2025 Total 2.6 1.9 4.5 Toronto's Projected 2026 Rank 11 12 13 Toronto's 2025 Rank 13 13 11 Source: Depth Charts courtesy of FanGraphs According to Depth Charts’ estimate, Blue Jays right fielders will produce the 12th-highest fWAR among MLB teams. That projected performance lags two of Toronto’s American League East rivals: the Yankees (7.0) and Red Sox (3.2). To no one’s surprise, Aaron Judge, with his 2026 6.6 fWAR, is the projected Right Field King of the American League East. Notably, Toronto’s projected fWAR leader in right field is Barger (1.0), whom Depth Charts also has with a 0.9 fWAR estimate at third base. The second table shows the career and 2025 OAA and FRV values for the right fielders. The first matter to note is that the projected starter in right field is Barger, who has logged 955 innings there, including 368 with the Buffalo Bisons. At the MLB level, in 587 innings, Barger has posted career OAA and FRV numbers of -4 and +2, respectively. His positive FRV score is due to his throwing ability. For the 2024-2025 period, Barger’s Fielder Throwing Runs is +5, tied with Fernando Tatis Jr. and Wilyer Abreu, each of whom logged considerably more innings in right field than Barger. On an FRV/1200 basis, Barger posted a +10 FRV/1200, much higher than Tatis and Abreu, both of whom have +3 FRV/1200. If Barger can improve his OAA numbers as he gains experience, he could become one of MLB’s better defenders in right field. Concerning Toronto’s other right fielders, both Lukes and Sánchez have produced better-than-average OAA and FRV/1200 marks. I expect Lukes will be Barger’s most-frequently used right field backup, but Sánchez and his MLB experience will spend time in right field. However, Springer’s best days as a right fielder appear to have passed. In 2025, he recorded a -5 OAA and a -6 FRV in 284 innings. Springer may see playing time in Toronto’s right fielder in 2026, but we should expect below-average defence. Straw has roamed an MLB right field for a total of 71 innings in his career (0 OAA and FRV scores). Yet, if Straw is called upon by John Schneider, given his fielding resume, he should be fine in right field. Right Field Innings RF OAA Per 1200 RF FRV Per 1200 Career 2025 Career 2025 Career 2025 Jesús Sánchez 2,778 724 2 2 2 3 Addison Barger 587 413 -8 -12 4 -3 Nathan Lukes 551 446 9 11 13 13 George Springer 6,681 284 0 -21 -1 -25 Source: FanGraphs The Bad In 2025, Toronto batters had 6,180 plate appearances, 1,680 (26%) of which were against left-handed pitchers. Blue Jays right fielders produced a 58 wRC+ (27th highest) versus lefties. Overall, Toronto’s right fielders posted a 104 wRC+ (12th best), including a 120 wRC+ when facing right-handers (MLB’s 10th best). Alas, a final table. Career Plate Appearances Career wRC+ LHP RHP Total LHP RHP Overall Jesús Sánchez 378 1,681 2,059 41 111 98 Addison Barger 126 601 727 53 104 95 Nathan Lukes 72 488 560 83 109 106 George Springer 1,672 4,702 6,374 134 128 130 Myles Straw 707 1,572 2,279 74 83 80 Source: FanGraphs Suppose the primary right fielders for the 2026 Blue Jays will be Barger and Lukes. Accordingly, as the table below shows, their career wRC+ numbers do not scream, “Look out, Judge, we’re coming for the Right Field King crown!” Against left-handed pitchers, Barger’s career wRC+ is 53 and Lukes’ is 83. Yikes! When facing right-handed pitchers, Lukes’ career 109 wRC+ is slightly better than Barger’s 104. Toronto’s 2026 right field crew appears to be noticeably better defensively than offensively. However, there is hope. Namely, the emergence of Barger as a particularly good MLB hitter. The key data points supporting this opinion are as follows: During Toronto’s 2026 postseason run, Barger generated a .376 xwOBA in 68 plate appearances. He produced a .343 xwOBA against left-handed pitchers in 15 plate appearances. Barger’s 2026 spring training numbers have been noteworthy. According to TJStats.ca, Barger has a .367 xwOBA in 44 plate appearances. His xwOBA versus lefties is .409 in 13 plate appearances. (Editor's Note: These stats were taken prior to Sunday's game, in which Barger went 3-for-4.) Of course, the postseason and spring training numbers both carry the small-sample-size warning, along with the questionable quality of spring training competition caveat. However, given Barger’s performance after the 2025 regular season concluded, the benefit of additional MLB experience, and the magic of David Popkins and his fellow hitting gurus, Barger is poised to perform better at the plate, including versus lefties, than his Depth Charts projection and career record to date. The Last Word The FanGraphs Depth Charts 2026 corner outfield projections place the Blue Jays at 13th in MLB (4.7 fWAR), which lags three of their American League East rivals: Yankees (9.6), Red Sox (6.8), and Orioles (5.2). Among right fielder crews, Toronto’s projected fWAR slots behind the Yankees and Red Sox in the division. As a group, the Blue Jays’ right fielders should be above average defensively. The question to be answered is whether Toronto’s right field crew will hit better than projected. On the negative side of the ledger, Barger and Lukes have below-average career wRC+ marks when facing left-handers. Regular season history suggests that Toronto’s 2026 right fielders will not be lefty mashers. However, there is room for optimism on that front. Barger appears ready to take the next step as a bona fide MLB hitter, including when facing lefties, as evidenced by his 2025 postseason and 2026 spring training results. However, the optimism meter should be dialled back a little if Barger’s 2026 batting performance versus lefties is much closer to his career .243 wOBA than his spring training .485. Time will tell. View full article
-
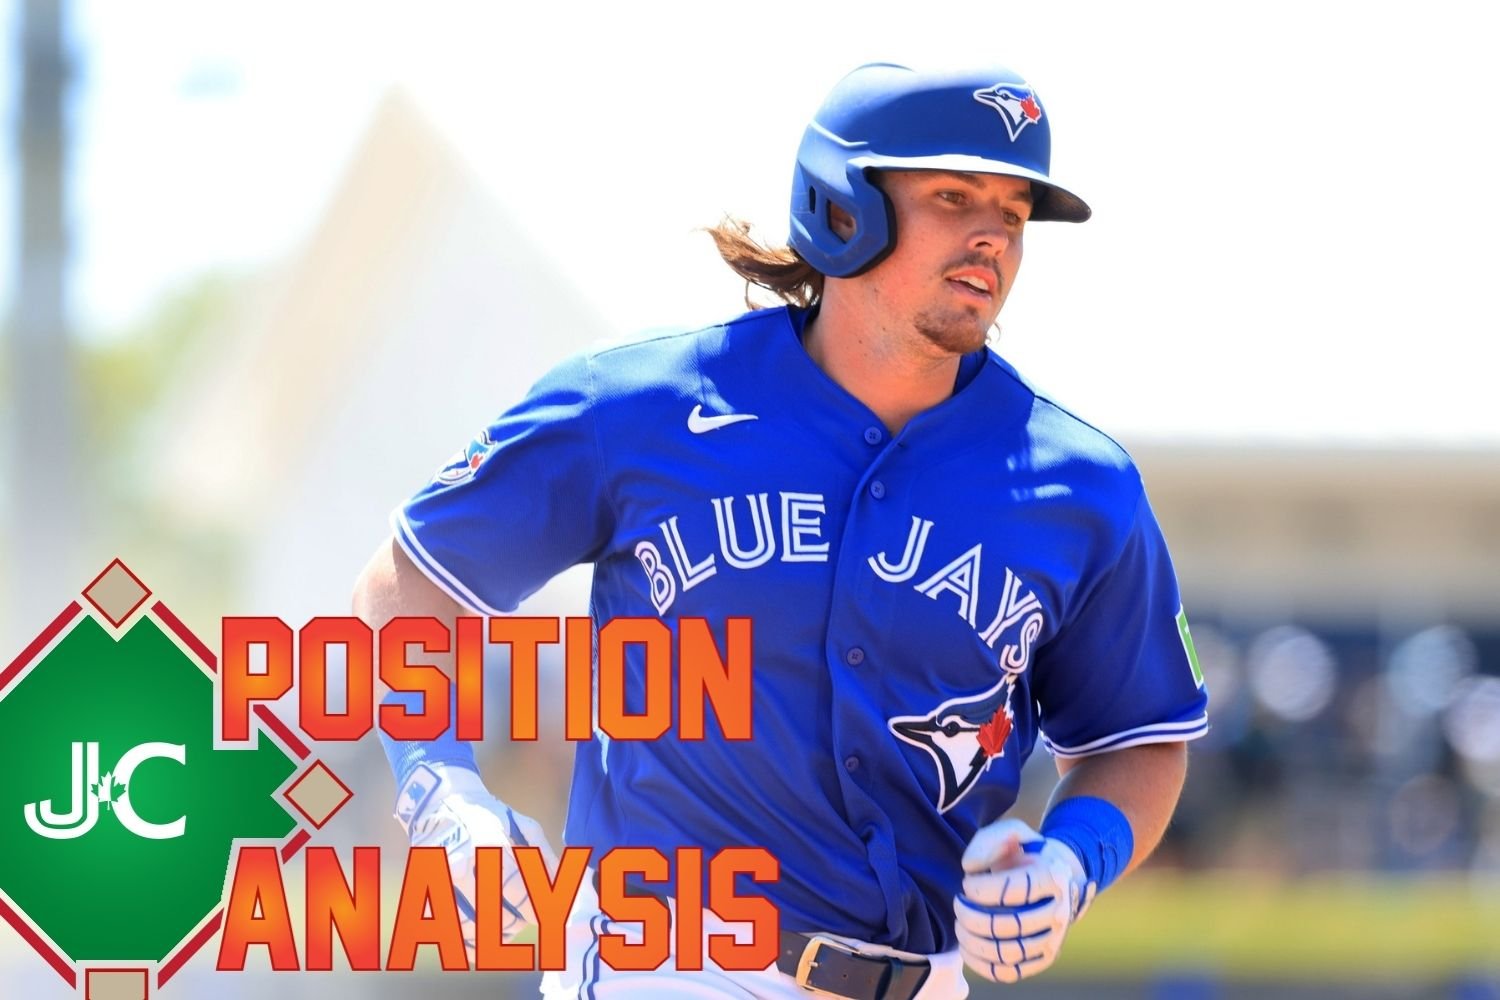 Jays Centre is taking a close look at every position on the Toronto Blue Jays heading into the 2026 season. Check out prior entries in the series here: Catcher First Base Second Base Third Base Left Field Toronto Blue Jays Right Fielders at a Glance Starter: Addison Barger Backup: Nathan Lukes Depth: Jesús Sánchez, Myles Straw, George Springer, Jonatan Clase Prospects: Yohendrick Pinango, RJ Schreck Blue Jays Right Field fWAR in 2025: 13th out of 30 (1.9) Blue Jays Right Field FGDC Projection for 2026: 12th (2.3) For the 2021-2025 period, Toronto’s fWAR production from right fielders ranks 13th-highest (11.9 fWAR). The best fWAR during these seasons was from the Yankees (30.5), the next closest was Houston’s 21.1. During those seasons, Toronto’s highest ranking was ninth place in 2021 and 2022; the lowest in 2023 (18th). Overall, cromulent performance. So, what does 2026 look like for Toronto’s right fielders? The Good Oh, yes, there are tables! The first is a summary of the FanGraphs Depth Charts’ 2026 projection for Toronto’s left and right fielders. I also used this table in my left fielder analysis because it shows that manager John Schneider has some flexibility to move corner outfielders between right and left field. This flexibility will be advantageous when constructing the starting lineup and for in-game substitutions. 2026 Projected fWAR LF RF Corner Jesús Sánchez 1.2 0.2 1.4 Addison Barger 1.0 1.0 Davis Schneider 0.4 0.4 Nathan Lukes 0.6 0.4 1.0 George Springer 0.1 0.6 0.7 Myles Straw - - - Projected 2026 Total 2.4 2.3 4.7 2025 Total 2.6 1.9 4.5 Toronto's Projected 2026 Rank 11 12 13 Toronto's 2025 Rank 13 13 11 Source: Depth Charts courtesy of FanGraphs According to Depth Charts’ estimate, Blue Jays right fielders will produce the 12th-highest fWAR among MLB teams. That projected performance lags two of Toronto’s American League East rivals: the Yankees (7.0) and Red Sox (3.2). To no one’s surprise, Aaron Judge, with his 2026 6.6 fWAR, is the projected Right Field King of the American League East. Notably, Toronto’s projected fWAR leader in right field is Barger (1.0), whom Depth Charts also has with a 0.9 fWAR estimate at third base. The second table shows the career and 2025 OAA and FRV values for the right fielders. The first matter to note is that the projected starter in right field is Barger, who has logged 955 innings there, including 368 with the Buffalo Bisons. At the MLB level, in 587 innings, Barger has posted career OAA and FRV numbers of -4 and +2, respectively. His positive FRV score is due to his throwing ability. For the 2024-2025 period, Barger’s Fielder Throwing Runs is +5, tied with Fernando Tatis Jr. and Wilyer Abreu, each of whom logged considerably more innings in right field than Barger. On an FRV/1200 basis, Barger posted a +10 FRV/1200, much higher than Tatis and Abreu, both of whom have +3 FRV/1200. If Barger can improve his OAA numbers as he gains experience, he could become one of MLB’s better defenders in right field. Concerning Toronto’s other right fielders, both Lukes and Sánchez have produced better-than-average OAA and FRV/1200 marks. I expect Lukes will be Barger’s most-frequently used right field backup, but Sánchez and his MLB experience will spend time in right field. However, Springer’s best days as a right fielder appear to have passed. In 2025, he recorded a -5 OAA and a -6 FRV in 284 innings. Springer may see playing time in Toronto’s right fielder in 2026, but we should expect below-average defence. Straw has roamed an MLB right field for a total of 71 innings in his career (0 OAA and FRV scores). Yet, if Straw is called upon by John Schneider, given his fielding resume, he should be fine in right field. Right Field Innings RF OAA Per 1200 RF FRV Per 1200 Career 2025 Career 2025 Career 2025 Jesús Sánchez 2,778 724 2 2 2 3 Addison Barger 587 413 -8 -12 4 -3 Nathan Lukes 551 446 9 11 13 13 George Springer 6,681 284 0 -21 -1 -25 Source: FanGraphs The Bad In 2025, Toronto batters had 6,180 plate appearances, 1,680 (26%) of which were against left-handed pitchers. Blue Jays right fielders produced a 58 wRC+ (27th highest) versus lefties. Overall, Toronto’s right fielders posted a 104 wRC+ (12th best), including a 120 wRC+ when facing right-handers (MLB’s 10th best). Alas, a final table. Career Plate Appearances Career wRC+ LHP RHP Total LHP RHP Overall Jesús Sánchez 378 1,681 2,059 41 111 98 Addison Barger 126 601 727 53 104 95 Nathan Lukes 72 488 560 83 109 106 George Springer 1,672 4,702 6,374 134 128 130 Myles Straw 707 1,572 2,279 74 83 80 Source: FanGraphs Suppose the primary right fielders for the 2026 Blue Jays will be Barger and Lukes. Accordingly, as the table below shows, their career wRC+ numbers do not scream, “Look out, Judge, we’re coming for the Right Field King crown!” Against left-handed pitchers, Barger’s career wRC+ is 53 and Lukes’ is 83. Yikes! When facing right-handed pitchers, Lukes’ career 109 wRC+ is slightly better than Barger’s 104. Toronto’s 2026 right field crew appears to be noticeably better defensively than offensively. However, there is hope. Namely, the emergence of Barger as a particularly good MLB hitter. The key data points supporting this opinion are as follows: During Toronto’s 2026 postseason run, Barger generated a .376 xwOBA in 68 plate appearances. He produced a .343 xwOBA against left-handed pitchers in 15 plate appearances. Barger’s 2026 spring training numbers have been noteworthy. According to TJStats.ca, Barger has a .367 xwOBA in 44 plate appearances. His xwOBA versus lefties is .409 in 13 plate appearances. (Editor's Note: These stats were taken prior to Sunday's game, in which Barger went 3-for-4.) Of course, the postseason and spring training numbers both carry the small-sample-size warning, along with the questionable quality of spring training competition caveat. However, given Barger’s performance after the 2025 regular season concluded, the benefit of additional MLB experience, and the magic of David Popkins and his fellow hitting gurus, Barger is poised to perform better at the plate, including versus lefties, than his Depth Charts projection and career record to date. The Last Word The FanGraphs Depth Charts 2026 corner outfield projections place the Blue Jays at 13th in MLB (4.7 fWAR), which lags three of their American League East rivals: Yankees (9.6), Red Sox (6.8), and Orioles (5.2). Among right fielder crews, Toronto’s projected fWAR slots behind the Yankees and Red Sox in the division. As a group, the Blue Jays’ right fielders should be above average defensively. The question to be answered is whether Toronto’s right field crew will hit better than projected. On the negative side of the ledger, Barger and Lukes have below-average career wRC+ marks when facing left-handers. Regular season history suggests that Toronto’s 2026 right fielders will not be lefty mashers. However, there is room for optimism on that front. Barger appears ready to take the next step as a bona fide MLB hitter, including when facing lefties, as evidenced by his 2025 postseason and 2026 spring training results. However, the optimism meter should be dialled back a little if Barger’s 2026 batting performance versus lefties is much closer to his career .243 wOBA than his spring training .485. Time will tell.
 -
Jays Centre is taking a close look at every position on the Toronto Blue Jays heading into the 2026 season. Check out prior entries in the series here: Catcher First Base Second Base Third Base Toronto Blue Jays Left Fielders at a Glance Starter: Jesús Sánchez Backup: Davis Schneider Depth: Nathan Lukes, Myles Straw, George Springer, Eloy Jiménez, Jonatan Clase Prospects: Yohendrick Pinango, RJ Schreck Blue Jays LF fWAR in 2025: 13th out of 30 (2.6) Blue Jays LF FGDC Projection for 2026: 11th (2.4) This was an oft-told joke before MLB adopted the universal designated hitter: Young child: Dad, what do they call the player who can't field but hits? Dad: In the American League, that player is called the designated hitter. Young child: What do they call that player in the National League? Dad: The left fielder. For the 2021-2025 period, Toronto’s fWAR production from left fielders ranks 10th-highest (10.9 fWAR). The best fWAR during these seasons was Milwaukee’s 17.9. During those seasons, the Blue Jays' highest ranking was in 2021 (seventh), and their lowest was in 2023 (22nd). Overall, solid performance. So, what does 2026 look like for Toronto’s left fielders? The Good I have tables! The first is a summary of the FanGraphs Depth Charts’ 2026 projection for Toronto’s left and right fielders. 2026 Projected fWAR LF RF Corner Jesús Sánchez 1.2 0.2 1.4 Addison Barger 1.0 1.0 Davis Schneider 0.4 0.4 Nathan Lukes 0.6 0.4 1.0 George Springer 0.1 0.6 0.7 Myles Straw - - - Projected 2026 total 2.4 2.3 4.5 2025 total 2.6 1.9 4.5 Toronto's Projected Rank - 2026 11 12 13 Toronto's Rank - 2025 13 13 11 Source: Depth Charts courtesy of FanGraphs According to the FGDC estimate, Blue Jays left fielders will produce the 11th-highest fWAR among MLB teams. That projected performance for the Blue Jays lags three of Toronto’s American League East rivals: the Red Sox (3.6), Orioles (2.8), and Yankees (2.6). However, Toronto’s 2.4 fWAR estimate is in the ballpark of their division foes. The newest member of Toronto’s left field crew is Sánchez. Notably, of the 4,127 innings he has spent in an MLB outfield, only 14% of those innings were as a left fielder. Most of his innings have been in right field (67%), where he has posted career OAA/1200 and FRV/1200 marks of 5 and 4, respectively. Despite Sánchez’s above-average defence in right field, it is understandable why Toronto has slated Addison Barger to roam right field, given his projected 107 wRC+ and career +4 FRV/1200 as a right fielder. The second table shows the career and 2025 OAA and FRV values for each of Toronto's left fielders, including Sánchez. (Please note that for comparison purposes, I converted each player's OAA and FRV totals, regardless of the number of innings they've played in left field, into OAA and FRV per 1,200 innings.) The first matter to note is that none of these players has accumulated many MLB innings in left field. Accordingly, their OAA and FRV per 1200 scores are not reliably predictive of future performance. However, Straw’s record as a center fielder strongly suggests that he would excel in left field. Also, given his right field record, Sánchez should be at least average after he accumulates more left field innings under his belt. However, Schneider and Lukes are open questions. Schneider did not perform well as a left fielder last season (-2 FRV in 347 innings), but he was fine in his previous 650 innings stationed in left (+1 FRV). Given that he produced a +4 OAA and a +5 FRV in 446 innings in right last season, Lukes should be able to handle left field duties adequately. For the record, Jiménez has not played in an MLB left field since 2021. In 1,957 innings in left field, his career OAA and FRV per 1200 are -11 and -13, respectively. Not good. Lastly, I expect Springer will see limited innings in the outfield in 2026, most of them in right field. Left Field Innings Left Field OAA Per 1200 Left Field FRV Per 1200 Career 2025 Career 2025 Career 2025 Jesús Sánchez 583 191 2 0 2 6 Davis Schneider 997 347 2 -3 1 -7 Nathan Lukes 353 249 -3 -10 7 0 George Springer 88 85 0 0 -14 -14 Myles Straw 165 121 29 20 22 20 Source: FanGraphs The Bad In 2025, Toronto batters took 6,180 plate appearances, 1,680 (26%) of which were against left-handed pitchers. Blue Jays’ left fielders produced an 88 wRC+ (21st-highest) versus lefties. Overall, Toronto’s left fielders posted a 111 wRC+ (10th-best), including a 120 wRC+ when facing right-handers (MLB’s seventh-best). A final table for your reading pleasure. Because he has produced a 111 wRC+ in spring training, I included Jiménez's wRC+ in my analysis. Jiménez, who does not have an MLB contract, will presumably start the year at Triple A. Career Plate Appearances Career wRC+ LHP RHP Total LHP RHP Overall Jesús Sánchez 378 1,681 2,059 41 111 98 Addison Barger 126 601 727 53 104 95 Davis Schneider 320 502 822 105 112 109 Nathan Lukes 72 488 560 83 109 106 George Springer 1,672 4,702 6,374 134 128 130 Eloy Jiménez 527 1,599 2,126 99 116 112 Myles Straw 707 1,572 2,279 74 83 80 Source: FanGraphs When facing right-handed pitchers, the career wRC+ numbers of Sánchez, Schneider, Lukes, and Jiménez are solid. The concern is the performance of Toronto’s projected group of left fielders when facing left-handed pitchers. Only Schneider’s 105 wRC+ and Jiménez’s 99 are near or above average. The others (Sánchez, Lukes, and Straw) have been well-below-average hitters versus lefties, which is a concern, especially because Barger has a 53 wRC+ against left-handed pitchers. On days when opposing left-handers start, only when Schneider and Springer are the corner outfielders can the Blue Jays expect to have above-average bats in left and right field. If Hitting Master David Popkins and his band of hitting gurus can work their magic, career underperformers could improve their numbers when confronting left-handed pitchers. However, as of today, Toronto’s left fielders do not project to excel at the plate when a lefty is on the mound. The Last Word "It’s tough to make predictions, especially about the future." -Yogi Berra FanGraphs Depth Charts projects that Toronto’s left field crew will be solid in 2026. Manager John Schneider has many left field options to choose from when putting together his starting lineup or making an in-game change. The defence should be at least cromulent, and the bats above average when facing a right-handed pitcher. One concern is that, other than Springer, Toronto lacks a lefty masher who can play left field. View full article
-
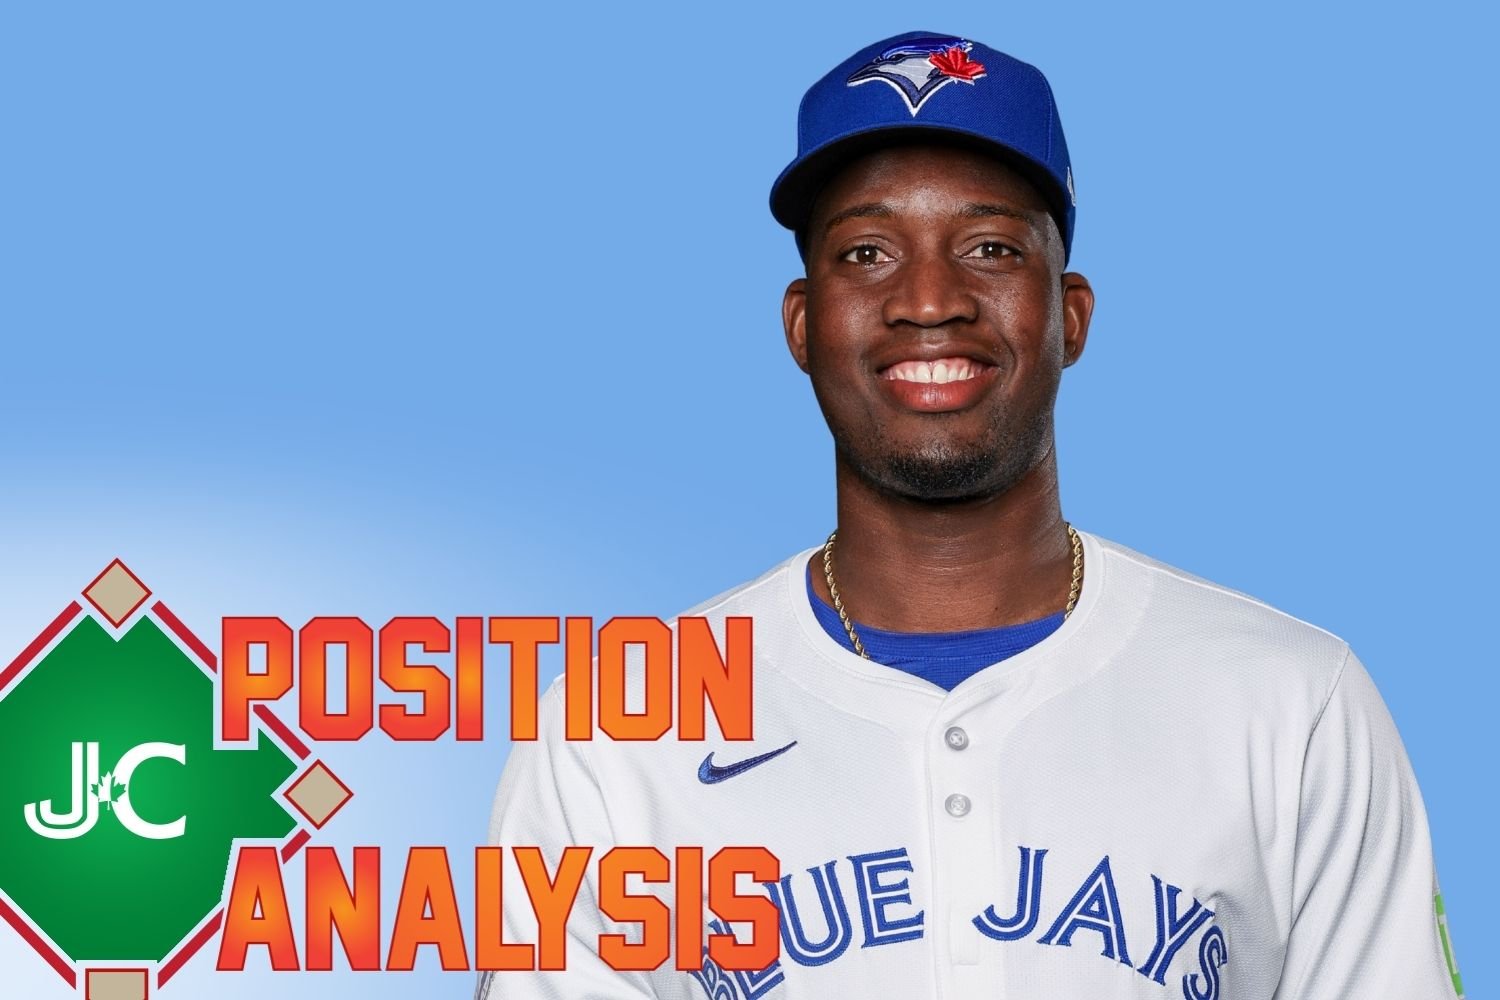 Jays Centre is taking a close look at every position on the Toronto Blue Jays heading into the 2026 season. Check out prior entries in the series here: Catcher First Base Second Base Third Base Toronto Blue Jays Left Fielders at a Glance Starter: Jesús Sánchez Backup: Davis Schneider Depth: Nathan Lukes, Myles Straw, George Springer, Eloy Jiménez, Jonatan Clase Prospects: Yohendrick Pinango, RJ Schreck Blue Jays LF fWAR in 2025: 13th out of 30 (2.6) Blue Jays LF FGDC Projection for 2026: 11th (2.4) This was an oft-told joke before MLB adopted the universal designated hitter: Young child: Dad, what do they call the player who can't field but hits? Dad: In the American League, that player is called the designated hitter. Young child: What do they call that player in the National League? Dad: The left fielder. For the 2021-2025 period, Toronto’s fWAR production from left fielders ranks 10th-highest (10.9 fWAR). The best fWAR during these seasons was Milwaukee’s 17.9. During those seasons, the Blue Jays' highest ranking was in 2021 (seventh), and their lowest was in 2023 (22nd). Overall, solid performance. So, what does 2026 look like for Toronto’s left fielders? The Good I have tables! The first is a summary of the FanGraphs Depth Charts’ 2026 projection for Toronto’s left and right fielders. 2026 Projected fWAR LF RF Corner Jesús Sánchez 1.2 0.2 1.4 Addison Barger 1.0 1.0 Davis Schneider 0.4 0.4 Nathan Lukes 0.6 0.4 1.0 George Springer 0.1 0.6 0.7 Myles Straw - - - Projected 2026 total 2.4 2.3 4.5 2025 total 2.6 1.9 4.5 Toronto's Projected Rank - 2026 11 12 13 Toronto's Rank - 2025 13 13 11 Source: Depth Charts courtesy of FanGraphs According to the FGDC estimate, Blue Jays left fielders will produce the 11th-highest fWAR among MLB teams. That projected performance for the Blue Jays lags three of Toronto’s American League East rivals: the Red Sox (3.6), Orioles (2.8), and Yankees (2.6). However, Toronto’s 2.4 fWAR estimate is in the ballpark of their division foes. The newest member of Toronto’s left field crew is Sánchez. Notably, of the 4,127 innings he has spent in an MLB outfield, only 14% of those innings were as a left fielder. Most of his innings have been in right field (67%), where he has posted career OAA/1200 and FRV/1200 marks of 5 and 4, respectively. Despite Sánchez’s above-average defence in right field, it is understandable why Toronto has slated Addison Barger to roam right field, given his projected 107 wRC+ and career +4 FRV/1200 as a right fielder. The second table shows the career and 2025 OAA and FRV values for each of Toronto's left fielders, including Sánchez. (Please note that for comparison purposes, I converted each player's OAA and FRV totals, regardless of the number of innings they've played in left field, into OAA and FRV per 1,200 innings.) The first matter to note is that none of these players has accumulated many MLB innings in left field. Accordingly, their OAA and FRV per 1200 scores are not reliably predictive of future performance. However, Straw’s record as a center fielder strongly suggests that he would excel in left field. Also, given his right field record, Sánchez should be at least average after he accumulates more left field innings under his belt. However, Schneider and Lukes are open questions. Schneider did not perform well as a left fielder last season (-2 FRV in 347 innings), but he was fine in his previous 650 innings stationed in left (+1 FRV). Given that he produced a +4 OAA and a +5 FRV in 446 innings in right last season, Lukes should be able to handle left field duties adequately. For the record, Jiménez has not played in an MLB left field since 2021. In 1,957 innings in left field, his career OAA and FRV per 1200 are -11 and -13, respectively. Not good. Lastly, I expect Springer will see limited innings in the outfield in 2026, most of them in right field. Left Field Innings Left Field OAA Per 1200 Left Field FRV Per 1200 Career 2025 Career 2025 Career 2025 Jesús Sánchez 583 191 2 0 2 6 Davis Schneider 997 347 2 -3 1 -7 Nathan Lukes 353 249 -3 -10 7 0 George Springer 88 85 0 0 -14 -14 Myles Straw 165 121 29 20 22 20 Source: FanGraphs The Bad In 2025, Toronto batters took 6,180 plate appearances, 1,680 (26%) of which were against left-handed pitchers. Blue Jays’ left fielders produced an 88 wRC+ (21st-highest) versus lefties. Overall, Toronto’s left fielders posted a 111 wRC+ (10th-best), including a 120 wRC+ when facing right-handers (MLB’s seventh-best). A final table for your reading pleasure. Because he has produced a 111 wRC+ in spring training, I included Jiménez's wRC+ in my analysis. Jiménez, who does not have an MLB contract, will presumably start the year at Triple A. Career Plate Appearances Career wRC+ LHP RHP Total LHP RHP Overall Jesús Sánchez 378 1,681 2,059 41 111 98 Addison Barger 126 601 727 53 104 95 Davis Schneider 320 502 822 105 112 109 Nathan Lukes 72 488 560 83 109 106 George Springer 1,672 4,702 6,374 134 128 130 Eloy Jiménez 527 1,599 2,126 99 116 112 Myles Straw 707 1,572 2,279 74 83 80 Source: FanGraphs When facing right-handed pitchers, the career wRC+ numbers of Sánchez, Schneider, Lukes, and Jiménez are solid. The concern is the performance of Toronto’s projected group of left fielders when facing left-handed pitchers. Only Schneider’s 105 wRC+ and Jiménez’s 99 are near or above average. The others (Sánchez, Lukes, and Straw) have been well-below-average hitters versus lefties, which is a concern, especially because Barger has a 53 wRC+ against left-handed pitchers. On days when opposing left-handers start, only when Schneider and Springer are the corner outfielders can the Blue Jays expect to have above-average bats in left and right field. If Hitting Master David Popkins and his band of hitting gurus can work their magic, career underperformers could improve their numbers when confronting left-handed pitchers. However, as of today, Toronto’s left fielders do not project to excel at the plate when a lefty is on the mound. The Last Word "It’s tough to make predictions, especially about the future." -Yogi Berra FanGraphs Depth Charts projects that Toronto’s left field crew will be solid in 2026. Manager John Schneider has many left field options to choose from when putting together his starting lineup or making an in-game change. The defence should be at least cromulent, and the bats above average when facing a right-handed pitcher. One concern is that, other than Springer, Toronto lacks a lefty masher who can play left field.
 -
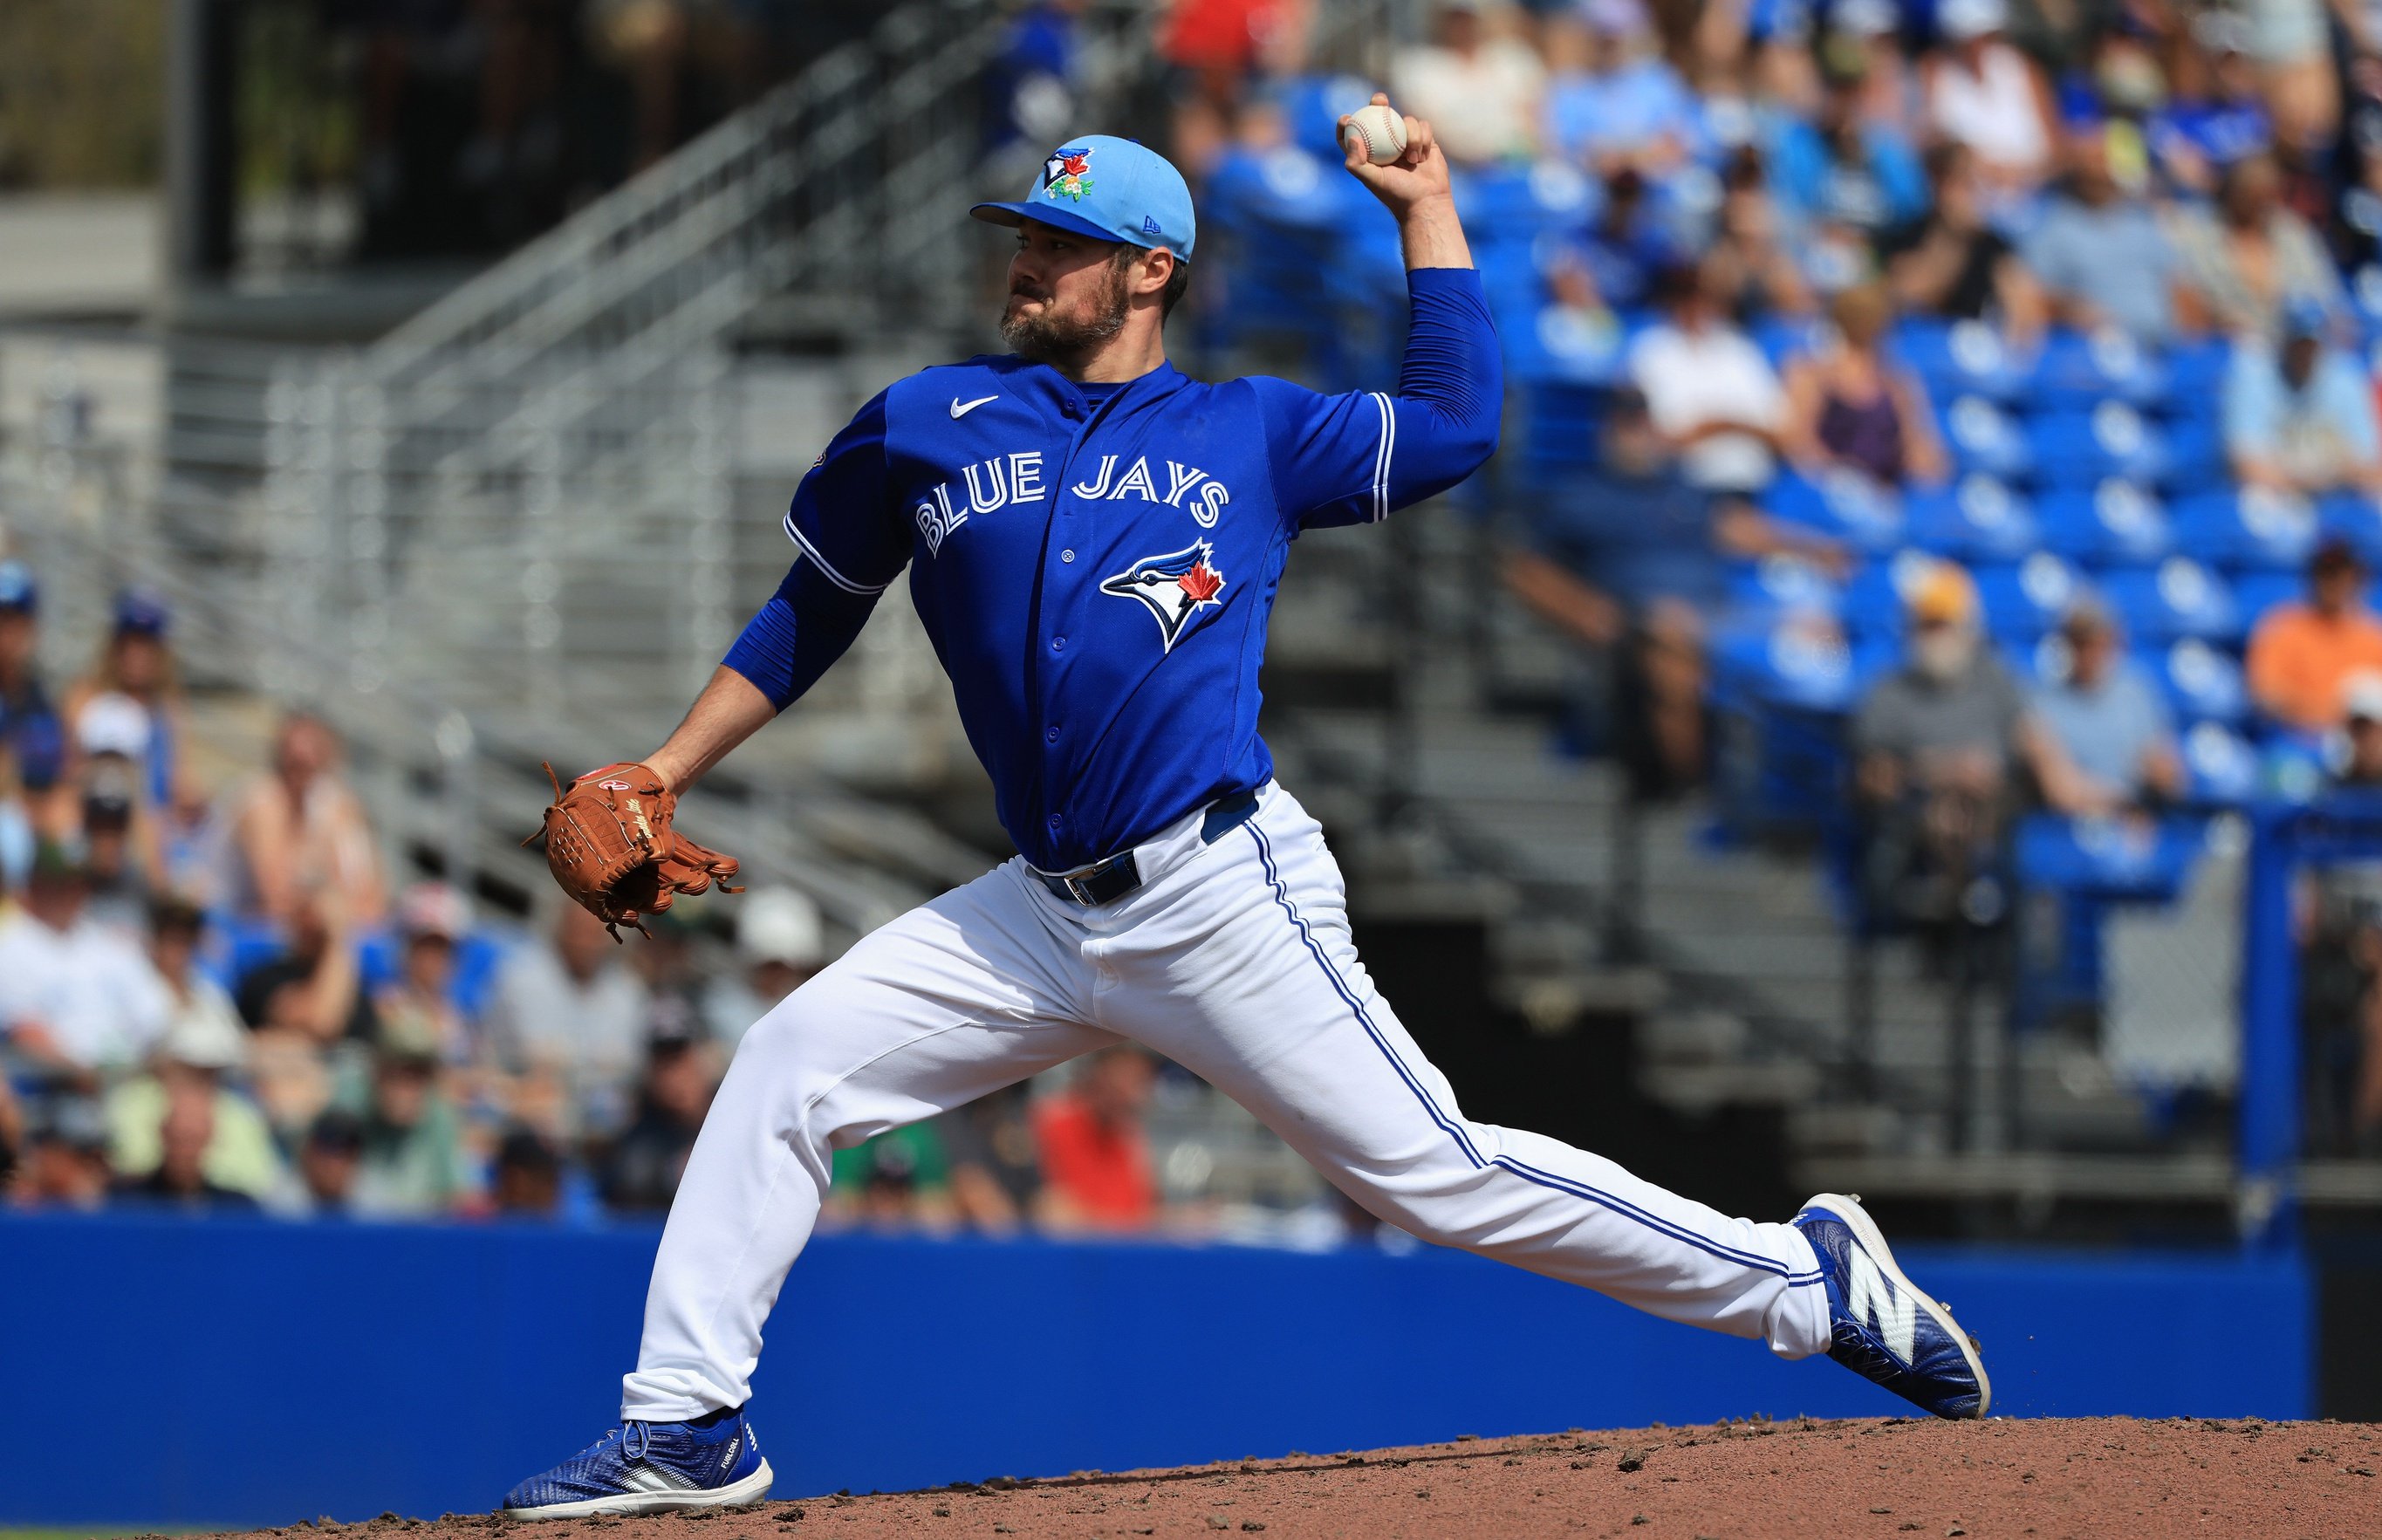 Brendon Little had an up-and-down 2025 season. Before August, among relievers with at least 20 innings, his xERA and K-BB% percentile rankings were 85th and 82nd, respectively. However, for the balance of the regular season, Little’s xERA and K-BB% percentile rankings slipped to 32nd and 7th, respectively. During Toronto’s postseason run, manager John Schneider used Little in only six of the Blue Jays’ 18 playoff games, including just once in the World Series. In those six outings, Little posted an 11.89 FIP, 3.00 WHIP and -0.84 WPA. Clearly, Little was much better before the calendar turned to August. So, which Little should we expect to witness in 2026? To answer that question, let’s dig into what happened in 2025. The table below is a good starting point. For the 2025 regular season, Little’s 72nd percentile xERA ranking was good, and his FIP (86th) was even better. And there are a few other points of interest. First, throughout 2025, Little’s BB% was near the worst among MLB relievers. As a result, his WHIP percentile ranking was negatively affected by the high walk rate. Second, Little’s K% percentile ranking was elite before August, but slipped to 37th after July. Games xERA FIP xFIP K% BB% K-BB% WHIP Before August 1 95th 85th 90th 94th 96th 2nd 82nd 39th After July 31 98th 32nd 57th 35th 37th 3rd 7th 3rd 2025 (1) 99th 72nd 86th 81st 90th 2nd 59th 29th (1) Before August 1, relievers with at least 20 innings (249 relievers); after July 31, relievers with at least 10 innings (261); and, for the season, relievers with at least 30 innings (244). Regular season only. Source: FanGraphs Let’s drill down to pitch type for a better understanding of Little’s performance. The table below has the details. His arsenal before August was a knuckle curve (48%), sinker (46%), cutter (5%), and a four-seam fastball (1%). After July, there was a noteworthy change: knuckle curve (39%), sinker (45%), cutter (15%), and four-seamer (1%). From a throwing-strikes perspective, it is understandable why Little reduced his use of the knuckle curve in favour of the cutter. After July, Little’s knuckle curve found the strike zone just 24% of the time, which was surpassed by the in-zone percentage of his cutter (60%). Furthermore, in the post-July period, Little’s cutter had the highest chase rate of his three main pitches, and the knuckle curve’s chase rate fell from 39% before August to 25% after July. Pitch Mix% Whiff% Zone% Swing% In-Zone O-Zone In-Zone O-Zone Knuckle Curve Before August 1 48 56 25 75 69 39 After July 31 39 55 24 76 76 25 Sinker Before August 1 46 36 48 52 49 23 After July 31 45 21 45 55 63 18 Cutter Before August 1 5 32 24 76 64 35 After July 31 15 28 60 40 61 29 2025 MLB 25 51 49 67 28 Source: Baseball Savant Concerning the metrics of his three most-used pitches, the next table shows, from a K% perspective, that only Little’s knuckle curve was elite throughout 2025. Regarding BB%, his knuckle curve’s walk rate spiked to 17.1% after July, and the sinker produced higher-than-average walk rates. An interesting stat is that Little’s post-July sinker K% was zero, despite his throwing it nine times (11% of pitches in two-strike counts). Overall, Little’s sinker was ineffective, mainly because that offering had a minus-9.5 K-BB%, compared to the average reliever's positive 13.5 K-BB%. On a positive note, all three pitches generated lower-than-average barrel/PA rates. K% BB% xwOBA Barrel /PA% K% BB% xwOBA Barrel /PA% Knuckle Curve Cutter Before August 1 55.7 6.6 0.181 3.8 Before August 1 8.3 16.7 0.336 0.0 After July 31 45.7 17.1 0.288 2.9 After July 31 27.3 9.1 0.292 0.0 2025 53.2 9.2 0.207 3.5 2025 17.4 13.0 0.315 0.0 Sinker Before August 1 14.3 20.2 0.373 4.8 After July 31 0.0 16.7 0.354 2.4 2025 9.5 19.0 0.367 4.0 MLB Reliever 22.8 9.3 0.311 5.3 Source: Baseball Savant One last table showing some of Little’s in-zone and out-of-zone metrics. The highlights from this table are as follows: Both in-zone and out-of-zone, batters did not hit for power against Little (better than average xISO numbers). Little’s in-zone K% was near the MLB average. However, while his pre-August 55.0% out-of-zone K% was elite, it was below average after July. Furthermore, Little’s post-July out-of-zone BB% soared to 50.0%. The change in out-of-zone K% and BB% numbers was consistent with the decline in batter chase rates from pre-August (33%) to post-July (22%). Despite Little’s better-than-average xISO, the elevated post-July .403 out-of-zone xwOBA is explained by the K% decline and BB% increase. An interesting factoid is that before August, Little had two walks called despite the pitch being located in the strike zone. xwOBA xISO K% BB% In-Zone O-Zone In-Zone O-Zone In-Zone O-Zone In-Zone O-Zone Before August 1 0.314 0.226 0.167 0.043 16.7 55.0 2.0 24.0 After July 31 0.283 0.403 0.065 0.003 16.9 30.0 0.0 50.0 2025 0.304 0.280 0.137 0.031 16.8 47.5 1.4 31.9 MLB 0.325 0.297 0.208 0.051 16.6 34.2 0.8 23.6 Source: Baseball Savant So far, I have identified three factors that contributed to Little’s performance slip after July. The struggle to locate his pitches in the strike zone. Batters chased Little’s pitches at a lower rate than before August. These two factors contributed to Little’s K-BB% falling from its pre-August heights of 20.4% to a mere 4.5% after July. Continued heavy usage of his sinker, an ineffective pitch (.367 xwOBA). The fourth and last factor that added to Little’s poor post-July performance woes appears to be fatigue. For the 2024 and 2025 regular seasons, including the 16 outings he had in Buffalo in 2024, Little had the fifth-most outings (144) and threw the sixth-most pitches (2,281) among relievers. Furthermore, John Schneider used Little a lot on short rest. For example, Houston’s Steven Okert posted a 2.63 xERA in 68 reliever outings in 2025. Of those outings, 72% (49) occurred on zero to two days' rest, and 49% (33) on less than two days' rest. On the other hand, of Little’s 79 outings, 90% happened on zero to two days' rest (71), and 59% on less than two days' rest (47). Little was a tired lad by the end of the 2025 regular season. Given the four noted factors that contributed to Little’s post-July underperformance, why should one expect Little to return to his pre-August self? Clearly, Little needs to make some changes, which Mitch Bannon of The Athletic discussed with the lefty (and covered in his February 14, 2026, article, Blue Jays bullpen bites: Brendon Little’s lessons, Tyler Rogers to WBC and more). The highlights from the conversation are as follows: Because Little was primarily a two-pitch pitcher, his catchers and opposing hitters knew that he tended to throw the knuckle curve when he was ahead in the count and the sinker when behind. The data support Little’s contention. When he was ahead, Little threw the knuckle curve 81% of the time (he used the sinker and cutter at 13% and 6% rates, respectively). When he was behind in the count, Little used the sinker 66% of the time (he threw the knuckle curve and cutter at 24% and 10% rates, respectively). Accordingly, Little told Bannon that he was adding a four-seam fastball and slider to his arsenal. In two outings this spring training, Little’s pitch mix (52 pitches) has comprised the knuckle curve (28.8%), four-seamer (21.2%), sinker (30.8%), and cutter (19.2%). It is noteworthy that, according to Baseball Savant, Little has not thrown a slider thus far. Hence, if Little can offer more competitive pitches in all count situations, the likelihood of better performance should increase. Furthermore, Little opined that the four-seam fastball and slider are easier to command, which should lower last season’s 15.3% BB%. To address the fatigue issue, Little noted that last season he often threw too many pitches in his pre-game or warmed up too quickly in the bullpen. He plans to conserve energy this season. Also, with Toronto’s addition of Tyler Rogers, and with a full season from Louis Varland, Schneider will have more reliever options, thereby reducing Little’s number of outings and giving him more rest between appearances. The Last Word Little has above-average stuff, which is what makes him so attractive as a pitcher. In 2025, the overall Stuff+ mark was 117, but his Location+ was only 81. If Pete Walker can work his magic, as he did with Robbie Ray, then through the addition of two easier-to-command pitches (four-seamer and slider), Little can hopefully improve his Location+. Nevertheless, one should expect Little to have a relatively high walk rate, but he can lower it to a more competitive level, which, combined with his high K%, should generate a well-above-average K-BB% score. Furthermore, Little has superior barrel/PA numbers, which will lead to a top-tier xERA (all things being equal). Lastly, a less fatigued Little in 2026 should perform better this season. Regarding the question of whether Little can replicate the best part of his 2025 season, the answer is yes. Will he? We will have to see!
 -
Brendon Little had an up-and-down 2025 season. Before August, among relievers with at least 20 innings, his xERA and K-BB% percentile rankings were 85th and 82nd, respectively. However, for the balance of the regular season, Little’s xERA and K-BB% percentile rankings slipped to 32nd and 7th, respectively. During Toronto’s postseason run, manager John Schneider used Little in only six of the Blue Jays’ 18 playoff games, including just once in the World Series. In those six outings, Little posted an 11.89 FIP, 3.00 WHIP and -0.84 WPA. Clearly, Little was much better before the calendar turned to August. So, which Little should we expect to witness in 2026? To answer that question, let’s dig into what happened in 2025. The table below is a good starting point. For the 2025 regular season, Little’s 72nd percentile xERA ranking was good, and his FIP (86th) was even better. And there are a few other points of interest. First, throughout 2025, Little’s BB% was near the worst among MLB relievers. As a result, his WHIP percentile ranking was negatively affected by the high walk rate. Second, Little’s K% percentile ranking was elite before August, but slipped to 37th after July. Games xERA FIP xFIP K% BB% K-BB% WHIP Before August 1 95th 85th 90th 94th 96th 2nd 82nd 39th After July 31 98th 32nd 57th 35th 37th 3rd 7th 3rd 2025 (1) 99th 72nd 86th 81st 90th 2nd 59th 29th (1) Before August 1, relievers with at least 20 innings (249 relievers); after July 31, relievers with at least 10 innings (261); and, for the season, relievers with at least 30 innings (244). Regular season only. Source: FanGraphs Let’s drill down to pitch type for a better understanding of Little’s performance. The table below has the details. His arsenal before August was a knuckle curve (48%), sinker (46%), cutter (5%), and a four-seam fastball (1%). After July, there was a noteworthy change: knuckle curve (39%), sinker (45%), cutter (15%), and four-seamer (1%). From a throwing-strikes perspective, it is understandable why Little reduced his use of the knuckle curve in favour of the cutter. After July, Little’s knuckle curve found the strike zone just 24% of the time, which was surpassed by the in-zone percentage of his cutter (60%). Furthermore, in the post-July period, Little’s cutter had the highest chase rate of his three main pitches, and the knuckle curve’s chase rate fell from 39% before August to 25% after July. Pitch Mix% Whiff% Zone% Swing% In-Zone O-Zone In-Zone O-Zone Knuckle Curve Before August 1 48 56 25 75 69 39 After July 31 39 55 24 76 76 25 Sinker Before August 1 46 36 48 52 49 23 After July 31 45 21 45 55 63 18 Cutter Before August 1 5 32 24 76 64 35 After July 31 15 28 60 40 61 29 2025 MLB 25 51 49 67 28 Source: Baseball Savant Concerning the metrics of his three most-used pitches, the next table shows, from a K% perspective, that only Little’s knuckle curve was elite throughout 2025. Regarding BB%, his knuckle curve’s walk rate spiked to 17.1% after July, and the sinker produced higher-than-average walk rates. An interesting stat is that Little’s post-July sinker K% was zero, despite his throwing it nine times (11% of pitches in two-strike counts). Overall, Little’s sinker was ineffective, mainly because that offering had a minus-9.5 K-BB%, compared to the average reliever's positive 13.5 K-BB%. On a positive note, all three pitches generated lower-than-average barrel/PA rates. K% BB% xwOBA Barrel /PA% K% BB% xwOBA Barrel /PA% Knuckle Curve Cutter Before August 1 55.7 6.6 0.181 3.8 Before August 1 8.3 16.7 0.336 0.0 After July 31 45.7 17.1 0.288 2.9 After July 31 27.3 9.1 0.292 0.0 2025 53.2 9.2 0.207 3.5 2025 17.4 13.0 0.315 0.0 Sinker Before August 1 14.3 20.2 0.373 4.8 After July 31 0.0 16.7 0.354 2.4 2025 9.5 19.0 0.367 4.0 MLB Reliever 22.8 9.3 0.311 5.3 Source: Baseball Savant One last table showing some of Little’s in-zone and out-of-zone metrics. The highlights from this table are as follows: Both in-zone and out-of-zone, batters did not hit for power against Little (better than average xISO numbers). Little’s in-zone K% was near the MLB average. However, while his pre-August 55.0% out-of-zone K% was elite, it was below average after July. Furthermore, Little’s post-July out-of-zone BB% soared to 50.0%. The change in out-of-zone K% and BB% numbers was consistent with the decline in batter chase rates from pre-August (33%) to post-July (22%). Despite Little’s better-than-average xISO, the elevated post-July .403 out-of-zone xwOBA is explained by the K% decline and BB% increase. An interesting factoid is that before August, Little had two walks called despite the pitch being located in the strike zone. xwOBA xISO K% BB% In-Zone O-Zone In-Zone O-Zone In-Zone O-Zone In-Zone O-Zone Before August 1 0.314 0.226 0.167 0.043 16.7 55.0 2.0 24.0 After July 31 0.283 0.403 0.065 0.003 16.9 30.0 0.0 50.0 2025 0.304 0.280 0.137 0.031 16.8 47.5 1.4 31.9 MLB 0.325 0.297 0.208 0.051 16.6 34.2 0.8 23.6 Source: Baseball Savant So far, I have identified three factors that contributed to Little’s performance slip after July. The struggle to locate his pitches in the strike zone. Batters chased Little’s pitches at a lower rate than before August. These two factors contributed to Little’s K-BB% falling from its pre-August heights of 20.4% to a mere 4.5% after July. Continued heavy usage of his sinker, an ineffective pitch (.367 xwOBA). The fourth and last factor that added to Little’s poor post-July performance woes appears to be fatigue. For the 2024 and 2025 regular seasons, including the 16 outings he had in Buffalo in 2024, Little had the fifth-most outings (144) and threw the sixth-most pitches (2,281) among relievers. Furthermore, John Schneider used Little a lot on short rest. For example, Houston’s Steven Okert posted a 2.63 xERA in 68 reliever outings in 2025. Of those outings, 72% (49) occurred on zero to two days' rest, and 49% (33) on less than two days' rest. On the other hand, of Little’s 79 outings, 90% happened on zero to two days' rest (71), and 59% on less than two days' rest (47). Little was a tired lad by the end of the 2025 regular season. Given the four noted factors that contributed to Little’s post-July underperformance, why should one expect Little to return to his pre-August self? Clearly, Little needs to make some changes, which Mitch Bannon of The Athletic discussed with the lefty (and covered in his February 14, 2026, article, Blue Jays bullpen bites: Brendon Little’s lessons, Tyler Rogers to WBC and more). The highlights from the conversation are as follows: Because Little was primarily a two-pitch pitcher, his catchers and opposing hitters knew that he tended to throw the knuckle curve when he was ahead in the count and the sinker when behind. The data support Little’s contention. When he was ahead, Little threw the knuckle curve 81% of the time (he used the sinker and cutter at 13% and 6% rates, respectively). When he was behind in the count, Little used the sinker 66% of the time (he threw the knuckle curve and cutter at 24% and 10% rates, respectively). Accordingly, Little told Bannon that he was adding a four-seam fastball and slider to his arsenal. In two outings this spring training, Little’s pitch mix (52 pitches) has comprised the knuckle curve (28.8%), four-seamer (21.2%), sinker (30.8%), and cutter (19.2%). It is noteworthy that, according to Baseball Savant, Little has not thrown a slider thus far. Hence, if Little can offer more competitive pitches in all count situations, the likelihood of better performance should increase. Furthermore, Little opined that the four-seam fastball and slider are easier to command, which should lower last season’s 15.3% BB%. To address the fatigue issue, Little noted that last season he often threw too many pitches in his pre-game or warmed up too quickly in the bullpen. He plans to conserve energy this season. Also, with Toronto’s addition of Tyler Rogers, and with a full season from Louis Varland, Schneider will have more reliever options, thereby reducing Little’s number of outings and giving him more rest between appearances. The Last Word Little has above-average stuff, which is what makes him so attractive as a pitcher. In 2025, the overall Stuff+ mark was 117, but his Location+ was only 81. If Pete Walker can work his magic, as he did with Robbie Ray, then through the addition of two easier-to-command pitches (four-seamer and slider), Little can hopefully improve his Location+. Nevertheless, one should expect Little to have a relatively high walk rate, but he can lower it to a more competitive level, which, combined with his high K%, should generate a well-above-average K-BB% score. Furthermore, Little has superior barrel/PA numbers, which will lead to a top-tier xERA (all things being equal). Lastly, a less fatigued Little in 2026 should perform better this season. Regarding the question of whether Little can replicate the best part of his 2025 season, the answer is yes. Will he? We will have to see! View full article
-
The National Bank's telecom analyst estimated that Rogers realized approximately CAD 100 million in additional revenue (gate receipts, media sales [Sportsnet], etc.) from the Blue Jays' postseason. Let's check it out. First, Rogers increased its MLSE holding from 37.5% to 75% on July 2, 2025. Second, before July 2, Rogers would have accounted for MLSE using the equity method, which means Rogers' 37.5% interest would be reported as a single item on the Statement of Operations (Income Statement), but not in the revenue line. However, when Rogers' MLSE interest increased to 75%, the accounting method would have switched from the equity method to full consolidation. Therefore, after July 1, 2025, Rogers Media would include each line item from MLSE's financial statements, including revenues. Accordingly, MLSE's revenues would be reflected in Rogers Media revenue, where they had not before July 2. Third, Staffieri said Rogers 2025 Media's revenue would have increased from CAD 3.3 billion to CAD 4.1 billion if it had held the 75% MLSE stake as of January 1, 2025. How much was MLSE's impact on Rogers' 2025 Q3 and Q4 revenue? Let's assume that all of MLSE's revenue comes from the Raptors and Leafs. Also, let's assume that the Raptors and Leafs record revenues during their respective seasons. Therefore, MLSE's CAD 800 million in Q1 and Q2 revenues occurred between January and April. That works out to be CAD 200 million per month. Hence, a rough estimate of MLSE's Q3 and Q4 revenues is CAD 0 million in Q3 and CAD 600 million in Q4 (3 months at CAD 200 million). Let's come back to Rogers Q4 numbers. 2025 Q4 revenues were CAD 1,240 million, and 2024 Q4 revenues were CAD 547 million. The 2025 Q4-2024 Q4 increase, excluding MLSE, is CAD 1,240 million, less 2024 Q4 CAD 547 million and CAD 600 million (the MLSE revenue bump), for a net increase of CAD 93 million. The CAD 93 million is close to the $100 million estimate from the National Bank for additional revenues from the Blue Jays' postseason run (ticket sales, media sales, etc.). Admittedly, this check is crude, but it shows that the CAD 100 million estimate of the Blue Jays' postseason revenue boost is in the ballpark.
-
I agree it isn't very clear, and it is because of two factors. First, sometimes "Jays" refers to the players; sometimes it means the owner (Rogers). Second, two currencies (CAD and USD) are in play. Concerning the "Jays", the players. All players who played in the 2025 postseason (Dodgers, Jays, Mariners, etc.) participate in the Players' Pool, which represents the players' share of postseason gate receipts. The players are entitled to 60% of the gate receipts from certain games (the first two games of all Wild Card series, the first three games of all Division Series, the first four games of all League Championship Series, and the first four games of the World Series). In total, players are entitled to 60% of the gate receipts from 32 postseason games. As the runner-up, MLB allocates 24% of the Players' Pool to Jays players and other Jays personnel. As Shi Davidi and others reported, the total amount of the Players' Pool was USD 128.2 million. Accordingly, MLB allocated USD 30.8 million to Jays players and other personnel (24% of USD 128.2 million). For a Jays player such as George Springer, a full share was worth USD 354,118. Concerning the "Jays", the owner (Rogers). In my article, I estimated that the Rogers share of the 2025 postseason net gate receipts was USD 36.9 million. It should be noted that teams/owners share gate receipts differently from the "players". While a player such as Springer shares in the gate receipts from all 32 postseason games that constitute the Players' Pool, the owners are treated differently. For example, Rogers shares equally with the Yankee owner in 100% of the gate receipts from Game 4 of the Division Series, and shares equally in the 40% ('Players" receive the other 60%) of the gate receipts from Games 1, 2 and 3 of the Toronto-New York Division Series. Similarly, Rogers shared equally with the Dodgers owner in 100% of World Series gate receipts from Games 5, 6, and 7, and in 40% of the gate receipts from Games 1, 2, 3, and 4. Owners share only in the gate receipts from the series their team played in. Rogers, for example, did not share in the gate receipts from the Seattle-Detroit series. In my article, I stated that my gate receipt estimate for Rogers (USD 36.9 million) did not include other revenue sources, such as Sportsnet and merchandise sales. I do not have access to those numbers and did not want to guess. I was comfortable estimating Rogers' share of postseason gate receipts because the Players' Pool amount (USD 128.2 million) was disclosed, and I know how the Players' Pool and owners' share is calculated (courtesy of FanGraphs and the CBA). Lastly, Leo Morgenstern noted the $100 million figure. That number was reported by the Financial Post, and is CAD, not USD. Also, the CAD 100 million is the estimate from Adam Shine, a National Bank telecom analyst. That CAD 100 million includes Rogers' share of gate receipts and other revenue sources, including the boost in Sportsnet's revenue. I hope this long-winded explanation helps. :)
-
Those figures concern the Players' Pool, of which Toronto (non-owner) splits USD 30.8 million (24% of USD 128.2 million) among Blue Jay players and other personnel. The USD 36.9 million is my estimate of Toronto's/Rogers share of net gate receipts. I provided the details in my article that Leo linked to.
-
The $36.9 million, which is in USD, is Toronto's (the owner's) net share of gate receipts from all series in which it played (Yankees, Mariners, and Dodgers). For example, the Blue Jays and Dodgers share equally in the World Series gate receipts to which the two ballclubs (the organizations, not the players) are entitled. In other words, as the World Series Champion, the Dodgers' owner does not receive a larger share of the World Series gate receipts than the Blue Jays' owner. The player's pool is a separate pot of gate receipt money that all postseason teams (not the owners) share. As the World Series runner-up, Toronto's (non-owner) share of the players' pool is the second-largest, at USD 30.8 million. The owners' and players' pools are determined as follows: MLB Rule 45 gives the Commissioner’s Office 15% of the paid attendance receipts for all postseason games. The remaining 85% is divided as follows: - Sixty percent of the paid attendance receipts from the first two games of the Wild Card Series is contributed to the Players' Pool. - Sixty percent of the paid attendance receipts from the first three games of the Division Series is contributed to the Players' Pool. - Sixty percent of the paid attendance receipts from the first four games of the Championship Series and the World Series are contributed to the Players' Pool. All paid attendance receipts not paid to the Commissioner’s Office or contributed to the Players' Pool are shared equally between the two teams in each Series.
-
A 2026 Blue Jays Projection: Is the Angst WARranted?
Bob Ritchie replied to Jim Scott's topic in Jays Centre Front Page News
Jason MacDonald of JFtC Fame?😁 -
I am optimistic that he can approach a 115 to 120ish wRC+ in 2026. His 2025 XWOBACAON was 0.433 (MLB Average is 0.368). He did change his batting stance in 2025 (6 degrees open to 5 degrees closed), so there were notable changes. Your thoughts on his "epiphany"? Would you sign Varsho to an extension, and if so, what dollar amount and term would you offer?
-
Starting in 2022, Daulton Varsho began to establish himself as an elite defensive outfielder. Of his 3,836 innings in the outfield, Varsho has played center (2,063), left (1,222) and right (551). Among the 51 center fielders with a minimum of 1,000 innings under their center field belts in that time, his 18 FRV/1200 slots in as the second highest. Concerning the corner outfield positions, Varsho has MLB’s highest FRV/1200 at 14. Did I mention that Varsho is elite defensively? Varsho has also been above average on the basepaths (9.0 XBR) during his career. Regarding hitting, he has been average (career 99 wRC+), although in limited plate appearances (271) in 2025, he generated a 123 wRC+, .345 wOBA, .326 xwOBA and .310 ISO. That ISO mark ranked seventh among the 309 batters with at least 250 plate appearances. Has Varsho turned the corner into becoming an above-average hitter? Time will tell. Concerning fWAR, Varsho has generated a 7.3 score during his three-season tenure with the Toronto Blue Jays. Suppose Varsho had not split time in center field with Kevin Kiermaier in 2023 and 2024. The corner outfield-to-center field positional adjustment boost would have raised his 2023 fWAR from 1.9 to 2.5 and his 2024 fWAR from 3.1 to 3.4. Regarding 2025, Varsho had two lengthy stints on the Injured list: March 27 to April 29 (shoulder) and June 1 to August 1 (hamstring). If one assumes the same level of fielding and hitting and doubles his innings from 550 to 1,100 and plate appearances from 271 to 542, Varsho’s 2025 fWAR soars to 4.5. When he played, Varsho was an All-Star-calibre player last season. An extension for an elite defensive center fielder entering his age-29 season should be simple. Well, no. Time for a journey through Table Land! Generally speaking, center field is the domain of younger players. Please refer to Tables 1 and 2. During the 2005-2025 period, excluding the pandemic-shortened 60-game 2020 season, there were 26 instances (1.3 per season) in which center fielders aged 31-35 started 120 or more games. There were 134 instances (6.7 per season) in which center fielders aged 26-30 started at least 120 games in a season. In percentage terms, among players who started 120 or more games in a season, 58% were older than 25 but younger than 31. By comparison, only 11% of the times that center fielders started at least 120 games in a campaign were those players older than 30 but younger than 36. For the 30-35 age group, Table 3 provides more detail. For the 2021 to 2025 period, no outfielder older than 30 started at least 120 games in center field; there were seven instances when a player older than 30 started more than 99 games in center field. During the most recent 10-year period with a 162-game regular season schedule (2015-2025), a player older than 30 started 120 or more games in center field eight times. Why the concern over players over the age of 30 starting at least 120 games in a season? Because fWAR is a key input used by teams to determine contract values. Two of the factors that affect fWAR are playing time (innings and plate appearances) and a player’s position. As players age, injuries tend to occur more frequently and take longer to heal, thereby reducing playing time. Moreover, as players age, Father Time becomes evident, resulting in diminished athleticism and performance. Hence, teams often move a center fielder to a corner outfield position in their 30s because their defensive skills are better suited to left or right field (see George Springer). Given the fWAR positional adjustment from center field (+2.5 runs) to left or right field (-7.5 runs), if the Blue Jays were to move Varsho to a corner outfield position during the term of the extension, his fWAR would decrease by approximately one win per season for the balance of the contract (all other things being equal). Therefore, a contract extension for Varsho, as he approaches his 30s, must account for the risk of reduced playing time and a position change. However, are there examples of well-above-average defenders in center field that continued to excel into their 30s? Yes, a limited number. I screened for center fielders who met the following criteria: Played in the majors during the 2005-2025 period. At the age of 30, they were well-above-average defensively according to the DRS metric and continued to excel into their early 30s. Reached the age of 35 during the 2005-2025 seasons. Because he is well known to Blue Jays fans, I included Kiermaier, who retired after his age-34 season (2024). I present Table 4. Carlos Beltrán’s center field defence was no longer well-above average after his age-31 season. However, because he posted a 131 wRC+ and 23.6 fWAR during his age-30 to 35 seasons, I am sure that Beltrán’s employers were unfazed that he no longer patrolled center field on a full-time basis. Still, his center field defence declined as he entered his 30s. Kiermaier remained superb defensively post-pandemic (17 DRS/1200), but, due to limited playing time (an average of 770 innings per season) because of injuries and below-average hitting (89 wRC+), Kiermaier generated a meager 6.7 fWAR over four seasons. After playing five games in 2020, Lorenzo Cain decided not to play during the balance of the pandemic-shortened season. In 2021, his age-35 campaign, he was on the injured list from June 1 to July 27 due to a hamstring injury. In total, he played 78 games in 2021. Yet, during his age-30 to 35 seasons, excluding 2020, Cain continued to excel defensively (15 DRS/1200) in 4,839 innings, and he posted a 105 wRC+ and 15.9 fWAR. He is an example of a player who was superb defensively at age 30 and continued to excel at age 33. We now turn to the Varsho contract extension matter. As Tables 1, 2 and 3 showed, it is unusual for a center fielder older than 29 to start 120 or more games in a season. Furthermore, it is rare for a center fielder to continue to log almost 1,000 innings a season and excel defensively after the age of 30. Cain is the sole example during the 2005-2025 period. Therefore, from Toronto’s perspective, the shorter the Varsho extension, the better. Behold Table 5! The key assumptions in Table 5 are as follows: The 2026 $/fWAR rate is $9 million, which is the figure used by Baseball Trade Values. An arbitrary 3% annual fWAR inflator. Cot’s Baseball Contracts’ $11.8 million arbitration award for the 2026 season. The 2026 3.5 fWAR projection is the average of Varsho’s boosted 2023, 2024, and 2025 fWAR numbers noted earlier (2.5, 3.4 and 4.5, respectively). The 3.5 figure is on the optimistic side, but I believe Varsho can nearly replicate his 2025 123 wRC+ and his defensive prowess in the future, at least in the short term. Varsho’s arm strength returns to its pre-2025 level. After his shoulder surgery in 2024, Varsho’s arm strength averaged 73.7 mph, down from the 83.9 and 83.7 mph in 2023 and 2024, respectively. Although Varsho’s arm strength was typically in the 40th percentile before last season, it was in the fifth percentile in 2025. My estimate of a fair contract is a four-year, $100 million deal that would run from 2026-29. The AAV is on the high side, but the contract does not extend beyond Varsho's age-32 season, when the risks of reduced playing time and a position switch are elevated. The Last Word The reader should note that shopping in the free agent market is different from buying broccoli at the grocery store. At the grocery store, a non-negotiable price is posted, and you can typically take the broccoli from the bin whenever you want it. The free agent market does not have a fixed price, nor can a team acquire a free agent on demand. I know the price of broccoli, but I do not know the market price of a Varsho extension; however, I can estimate it. With that proviso in mind, would Varsho accept a four-year, $100 million extension? I do not know, but it is a fair deal. The optimistic fWAR projection and higher AAV would benefit the player, and the short contract length addresses the team’s presumptive concerns regarding playing time and a potential switch from center field to a corner outfield position. View full article
-
What Is a Reasonable Contract Extension for Daulton Varsho?
Bob Ritchie posted an article in Blue Jays
.jpg.72e1bd44e4908baa4817b00a0de26f58.jpg) Starting in 2022, Daulton Varsho began to establish himself as an elite defensive outfielder. Of his 3,836 innings in the outfield, Varsho has played center (2,063), left (1,222) and right (551). Among the 51 center fielders with a minimum of 1,000 innings under their center field belts in that time, his 18 FRV/1200 slots in as the second highest. Concerning the corner outfield positions, Varsho has MLB’s highest FRV/1200 at 14. Did I mention that Varsho is elite defensively? Varsho has also been above average on the basepaths (9.0 XBR) during his career. Regarding hitting, he has been average (career 99 wRC+), although in limited plate appearances (271) in 2025, he generated a 123 wRC+, .345 wOBA, .326 xwOBA and .310 ISO. That ISO mark ranked seventh among the 309 batters with at least 250 plate appearances. Has Varsho turned the corner into becoming an above-average hitter? Time will tell. Concerning fWAR, Varsho has generated a 7.3 score during his three-season tenure with the Toronto Blue Jays. Suppose Varsho had not split time in center field with Kevin Kiermaier in 2023 and 2024. The corner outfield-to-center field positional adjustment boost would have raised his 2023 fWAR from 1.9 to 2.5 and his 2024 fWAR from 3.1 to 3.4. Regarding 2025, Varsho had two lengthy stints on the Injured list: March 27 to April 29 (shoulder) and June 1 to August 1 (hamstring). If one assumes the same level of fielding and hitting and doubles his innings from 550 to 1,100 and plate appearances from 271 to 542, Varsho’s 2025 fWAR soars to 4.5. When he played, Varsho was an All-Star-calibre player last season. An extension for an elite defensive center fielder entering his age-29 season should be simple. Well, no. Time for a journey through Table Land! Generally speaking, center field is the domain of younger players. Please refer to Tables 1 and 2. During the 2005-2025 period, excluding the pandemic-shortened 60-game 2020 season, there were 26 instances (1.3 per season) in which center fielders aged 31-35 started 120 or more games. There were 134 instances (6.7 per season) in which center fielders aged 26-30 started at least 120 games in a season. In percentage terms, among players who started 120 or more games in a season, 58% were older than 25 but younger than 31. By comparison, only 11% of the times that center fielders started at least 120 games in a campaign were those players older than 30 but younger than 36. For the 30-35 age group, Table 3 provides more detail. For the 2021 to 2025 period, no outfielder older than 30 started at least 120 games in center field; there were seven instances when a player older than 30 started more than 99 games in center field. During the most recent 10-year period with a 162-game regular season schedule (2015-2025), a player older than 30 started 120 or more games in center field eight times. Why the concern over players over the age of 30 starting at least 120 games in a season? Because fWAR is a key input used by teams to determine contract values. Two of the factors that affect fWAR are playing time (innings and plate appearances) and a player’s position. As players age, injuries tend to occur more frequently and take longer to heal, thereby reducing playing time. Moreover, as players age, Father Time becomes evident, resulting in diminished athleticism and performance. Hence, teams often move a center fielder to a corner outfield position in their 30s because their defensive skills are better suited to left or right field (see George Springer). Given the fWAR positional adjustment from center field (+2.5 runs) to left or right field (-7.5 runs), if the Blue Jays were to move Varsho to a corner outfield position during the term of the extension, his fWAR would decrease by approximately one win per season for the balance of the contract (all other things being equal). Therefore, a contract extension for Varsho, as he approaches his 30s, must account for the risk of reduced playing time and a position change. However, are there examples of well-above-average defenders in center field that continued to excel into their 30s? Yes, a limited number. I screened for center fielders who met the following criteria: Played in the majors during the 2005-2025 period. At the age of 30, they were well-above-average defensively according to the DRS metric and continued to excel into their early 30s. Reached the age of 35 during the 2005-2025 seasons. Because he is well known to Blue Jays fans, I included Kiermaier, who retired after his age-34 season (2024). I present Table 4. Carlos Beltrán’s center field defence was no longer well-above average after his age-31 season. However, because he posted a 131 wRC+ and 23.6 fWAR during his age-30 to 35 seasons, I am sure that Beltrán’s employers were unfazed that he no longer patrolled center field on a full-time basis. Still, his center field defence declined as he entered his 30s. Kiermaier remained superb defensively post-pandemic (17 DRS/1200), but, due to limited playing time (an average of 770 innings per season) because of injuries and below-average hitting (89 wRC+), Kiermaier generated a meager 6.7 fWAR over four seasons. After playing five games in 2020, Lorenzo Cain decided not to play during the balance of the pandemic-shortened season. In 2021, his age-35 campaign, he was on the injured list from June 1 to July 27 due to a hamstring injury. In total, he played 78 games in 2021. Yet, during his age-30 to 35 seasons, excluding 2020, Cain continued to excel defensively (15 DRS/1200) in 4,839 innings, and he posted a 105 wRC+ and 15.9 fWAR. He is an example of a player who was superb defensively at age 30 and continued to excel at age 33. We now turn to the Varsho contract extension matter. As Tables 1, 2 and 3 showed, it is unusual for a center fielder older than 29 to start 120 or more games in a season. Furthermore, it is rare for a center fielder to continue to log almost 1,000 innings a season and excel defensively after the age of 30. Cain is the sole example during the 2005-2025 period. Therefore, from Toronto’s perspective, the shorter the Varsho extension, the better. Behold Table 5! The key assumptions in Table 5 are as follows: The 2026 $/fWAR rate is $9 million, which is the figure used by Baseball Trade Values. An arbitrary 3% annual fWAR inflator. Cot’s Baseball Contracts’ $11.8 million arbitration award for the 2026 season. The 2026 3.5 fWAR projection is the average of Varsho’s boosted 2023, 2024, and 2025 fWAR numbers noted earlier (2.5, 3.4 and 4.5, respectively). The 3.5 figure is on the optimistic side, but I believe Varsho can nearly replicate his 2025 123 wRC+ and his defensive prowess in the future, at least in the short term. Varsho’s arm strength returns to its pre-2025 level. After his shoulder surgery in 2024, Varsho’s arm strength averaged 73.7 mph, down from the 83.9 and 83.7 mph in 2023 and 2024, respectively. Although Varsho’s arm strength was typically in the 40th percentile before last season, it was in the fifth percentile in 2025. My estimate of a fair contract is a four-year, $100 million deal that would run from 2026-29. The AAV is on the high side, but the contract does not extend beyond Varsho's age-32 season, when the risks of reduced playing time and a position switch are elevated. The Last Word The reader should note that shopping in the free agent market is different from buying broccoli at the grocery store. At the grocery store, a non-negotiable price is posted, and you can typically take the broccoli from the bin whenever you want it. The free agent market does not have a fixed price, nor can a team acquire a free agent on demand. I know the price of broccoli, but I do not know the market price of a Varsho extension; however, I can estimate it. With that proviso in mind, would Varsho accept a four-year, $100 million extension? I do not know, but it is a fair deal. The optimistic fWAR projection and higher AAV would benefit the player, and the short contract length addresses the team’s presumptive concerns regarding playing time and a potential switch from center field to a corner outfield position.
Starting in 2022, Daulton Varsho began to establish himself as an elite defensive outfielder. Of his 3,836 innings in the outfield, Varsho has played center (2,063), left (1,222) and right (551). Among the 51 center fielders with a minimum of 1,000 innings under their center field belts in that time, his 18 FRV/1200 slots in as the second highest. Concerning the corner outfield positions, Varsho has MLB’s highest FRV/1200 at 14. Did I mention that Varsho is elite defensively? Varsho has also been above average on the basepaths (9.0 XBR) during his career. Regarding hitting, he has been average (career 99 wRC+), although in limited plate appearances (271) in 2025, he generated a 123 wRC+, .345 wOBA, .326 xwOBA and .310 ISO. That ISO mark ranked seventh among the 309 batters with at least 250 plate appearances. Has Varsho turned the corner into becoming an above-average hitter? Time will tell. Concerning fWAR, Varsho has generated a 7.3 score during his three-season tenure with the Toronto Blue Jays. Suppose Varsho had not split time in center field with Kevin Kiermaier in 2023 and 2024. The corner outfield-to-center field positional adjustment boost would have raised his 2023 fWAR from 1.9 to 2.5 and his 2024 fWAR from 3.1 to 3.4. Regarding 2025, Varsho had two lengthy stints on the Injured list: March 27 to April 29 (shoulder) and June 1 to August 1 (hamstring). If one assumes the same level of fielding and hitting and doubles his innings from 550 to 1,100 and plate appearances from 271 to 542, Varsho’s 2025 fWAR soars to 4.5. When he played, Varsho was an All-Star-calibre player last season. An extension for an elite defensive center fielder entering his age-29 season should be simple. Well, no. Time for a journey through Table Land! Generally speaking, center field is the domain of younger players. Please refer to Tables 1 and 2. During the 2005-2025 period, excluding the pandemic-shortened 60-game 2020 season, there were 26 instances (1.3 per season) in which center fielders aged 31-35 started 120 or more games. There were 134 instances (6.7 per season) in which center fielders aged 26-30 started at least 120 games in a season. In percentage terms, among players who started 120 or more games in a season, 58% were older than 25 but younger than 31. By comparison, only 11% of the times that center fielders started at least 120 games in a campaign were those players older than 30 but younger than 36. For the 30-35 age group, Table 3 provides more detail. For the 2021 to 2025 period, no outfielder older than 30 started at least 120 games in center field; there were seven instances when a player older than 30 started more than 99 games in center field. During the most recent 10-year period with a 162-game regular season schedule (2015-2025), a player older than 30 started 120 or more games in center field eight times. Why the concern over players over the age of 30 starting at least 120 games in a season? Because fWAR is a key input used by teams to determine contract values. Two of the factors that affect fWAR are playing time (innings and plate appearances) and a player’s position. As players age, injuries tend to occur more frequently and take longer to heal, thereby reducing playing time. Moreover, as players age, Father Time becomes evident, resulting in diminished athleticism and performance. Hence, teams often move a center fielder to a corner outfield position in their 30s because their defensive skills are better suited to left or right field (see George Springer). Given the fWAR positional adjustment from center field (+2.5 runs) to left or right field (-7.5 runs), if the Blue Jays were to move Varsho to a corner outfield position during the term of the extension, his fWAR would decrease by approximately one win per season for the balance of the contract (all other things being equal). Therefore, a contract extension for Varsho, as he approaches his 30s, must account for the risk of reduced playing time and a position change. However, are there examples of well-above-average defenders in center field that continued to excel into their 30s? Yes, a limited number. I screened for center fielders who met the following criteria: Played in the majors during the 2005-2025 period. At the age of 30, they were well-above-average defensively according to the DRS metric and continued to excel into their early 30s. Reached the age of 35 during the 2005-2025 seasons. Because he is well known to Blue Jays fans, I included Kiermaier, who retired after his age-34 season (2024). I present Table 4. Carlos Beltrán’s center field defence was no longer well-above average after his age-31 season. However, because he posted a 131 wRC+ and 23.6 fWAR during his age-30 to 35 seasons, I am sure that Beltrán’s employers were unfazed that he no longer patrolled center field on a full-time basis. Still, his center field defence declined as he entered his 30s. Kiermaier remained superb defensively post-pandemic (17 DRS/1200), but, due to limited playing time (an average of 770 innings per season) because of injuries and below-average hitting (89 wRC+), Kiermaier generated a meager 6.7 fWAR over four seasons. After playing five games in 2020, Lorenzo Cain decided not to play during the balance of the pandemic-shortened season. In 2021, his age-35 campaign, he was on the injured list from June 1 to July 27 due to a hamstring injury. In total, he played 78 games in 2021. Yet, during his age-30 to 35 seasons, excluding 2020, Cain continued to excel defensively (15 DRS/1200) in 4,839 innings, and he posted a 105 wRC+ and 15.9 fWAR. He is an example of a player who was superb defensively at age 30 and continued to excel at age 33. We now turn to the Varsho contract extension matter. As Tables 1, 2 and 3 showed, it is unusual for a center fielder older than 29 to start 120 or more games in a season. Furthermore, it is rare for a center fielder to continue to log almost 1,000 innings a season and excel defensively after the age of 30. Cain is the sole example during the 2005-2025 period. Therefore, from Toronto’s perspective, the shorter the Varsho extension, the better. Behold Table 5! The key assumptions in Table 5 are as follows: The 2026 $/fWAR rate is $9 million, which is the figure used by Baseball Trade Values. An arbitrary 3% annual fWAR inflator. Cot’s Baseball Contracts’ $11.8 million arbitration award for the 2026 season. The 2026 3.5 fWAR projection is the average of Varsho’s boosted 2023, 2024, and 2025 fWAR numbers noted earlier (2.5, 3.4 and 4.5, respectively). The 3.5 figure is on the optimistic side, but I believe Varsho can nearly replicate his 2025 123 wRC+ and his defensive prowess in the future, at least in the short term. Varsho’s arm strength returns to its pre-2025 level. After his shoulder surgery in 2024, Varsho’s arm strength averaged 73.7 mph, down from the 83.9 and 83.7 mph in 2023 and 2024, respectively. Although Varsho’s arm strength was typically in the 40th percentile before last season, it was in the fifth percentile in 2025. My estimate of a fair contract is a four-year, $100 million deal that would run from 2026-29. The AAV is on the high side, but the contract does not extend beyond Varsho's age-32 season, when the risks of reduced playing time and a position switch are elevated. The Last Word The reader should note that shopping in the free agent market is different from buying broccoli at the grocery store. At the grocery store, a non-negotiable price is posted, and you can typically take the broccoli from the bin whenever you want it. The free agent market does not have a fixed price, nor can a team acquire a free agent on demand. I know the price of broccoli, but I do not know the market price of a Varsho extension; however, I can estimate it. With that proviso in mind, would Varsho accept a four-year, $100 million extension? I do not know, but it is a fair deal. The optimistic fWAR projection and higher AAV would benefit the player, and the short contract length addresses the team’s presumptive concerns regarding playing time and a potential switch from center field to a corner outfield position. -
The Toronto Blue Jays fell short of winning the 2025 World Series, but their lengthy postseason run yielded financial benefits to the players, other personnel, and the team/owner. As Jay Centre’s Leo Morgenstern noted in his article, Details on Blue Jays' Share of Postseason Revenue Pool, Toronto’s players and other employees will share in the $128.2 million players’ pool. The amount allocated to the Blue Jays was $30.8 million. At the club/owner level, there were also financial rewards from the Blue Jays’ postseason journey. From this point forward, unless stated otherwise, any reference to what the Blue Jays received from the postseason run excludes any compensation due to the players or other employees. In other words, the focus is on the financial benefits to the Blue Jays’ company/Rogers Communications. The first reward is Toronto’s share of postseason gate receipts. This number is not currently publicly available, but we can use the $128.2 million players’ pool figure and other publicly available figures to estimate the amount the Blue Jays received in postseason gate receipts. Let’s get started! Below is an excerpt from a 2012 FanGraphs article. My understanding is that the allocation above is accurate except for the Wild Card games. When Wendy Thurm wrote the aforementioned FanGraphs article, the Wild Card round was only one game long, as opposed to the current best-of-three format. Under the current Collective Bargaining Agreement (Article X), players receive 60 percent of paid attendance receipts for the first two games of each Wild Card Series. So, what were the total gate receipts from the 2025 postseason? A back-of-the-envelope calculation is as follows: There were 47 playoff games in 2025, 32 of which were games used to determine the $128.2 million players’ pool amount. Given that the players’ share of the gate receipts is 60% of the games noted in the excerpt, those games are equivalent to 19.2 games (32 games x 0.60). Accordingly, the gate receipts per game are $6.7 million ($128.2 million / 19.2 games). Total gate receipts are the number of games multiplied by the gate receipts per game. Hence, total gate receipts are $314.9 million (47 games x $6.7 million). The Commissioner’s Office would receive $47.2 million ($314.9 million x 0.15). Accordingly, the "teams’ pool" is $139.5 million ($314.9 million - $128.2 million - $47.2 million). However, concerning Toronto’s share of gate receipts, we require a more detailed calculation because postseason teams do not share in the teams’ pool per se. Instead, the two teams in each series share equally in the gate receipts allocated to them. Therefore, a more precise estimate of Toronto’s share of gate receipts requires attendance figures and ticket prices for each series. Onto the tables! Table 1 shows MLB’s 2025 postseason attendance by series. Table 2 presents my estimates of gate receipts by series and the allocation of gate receipts to players, teams, and the Commissioner’s Office. Please note that I increased the average ticket price as the postseason continued. I arbitrarily increased the average Wild Card Series ticket price for the Division Series, Championship Series and World Series by factors of 1.25, 1.50 and 2.00, respectively. I am comfortable with the ticket prices shown because they generated the $128.2 million Players’ Pool figure, and the $316.7 million total gate receipts were within 0.6% of my back-of-the-envelope $314.9 million estimate. Please note that, for each series Toronto played, the teams’ share of gate receipts was split equally between the ballclubs. Accordingly, the Blue Jays shared gate receipts with the Yankees (Division Series), the Mariners (League Championship Series), and the Dodgers (World Series). Hence, Tables 1 and 2, and the supporting numbers, are essential for calculating Toronto’s share of gate receipts. Behold Table 3! Toronto’s share of gate receipts was $48.2 million, comprised of the 20 percent share (50% of 40% or $18.2 million, the sum of Rows A) of gate receipts that were also allocated to the Players’ Pool, and the half-share (50% of 100% or $30.0 million, the sum of Rows B) of the gate receipts distributable to the two teams. Lastly, the fee due to the Commissioner’s Office (15% of $48.2 million or $11.3 million) is deducted, leaving Rogers with a tidy net sum of $36.9 million. In addition to the postseason gate receipts, there are other benefits to the team/Rogers that I cannot calculate. These include increased merchandise, concession, and other game-related revenues attributable to the postseason. Additionally, regular season revenue streams and ticket sales likely increased due to Toronto’s run for the American League East division title. Additionally, 2026 ticket sales should increase due to a successful 2025 regular season and playoff campaign. Lastly, Rogers owns Sportsnet, which holds the Blue Jays' television and radio rights. Although I do not have data to support this claim, Sportsnet’s television ratings, in particular, must have increased substantially, benefiting the broadcaster and, indirectly, Rogers financially. A non-financial reward of the regular season and postseason could be that free agents are viewing the Blue Jays more favourably as a destination. Toronto’s extended playoff run, together with the enthusiastic nationwide fan support during the regular season and playoffs, should make the Blue Jays more attractive. Indeed, money is a significant factor for free agents, but players may view a team that projects to be a well-supported, successful franchise in 2026 more positively. The Last Word For the Toronto Blue Jays and their fans, the 2025 postseason did not culminate in a World Series championship. However, the players and the owner benefited financially from the playoff journey. The players and other employees will participate in their $30.8 million share of the players’ pool. The team/Rogers benefited from an estimated $36.9 million net share of 2025 postseason gate receipts. Other benefits to the team/owner include increased merchandise, concession, and other game-day-related revenue streams. May 2026 bring a World Series championship to the Blue Jays and their fans, as well as more financial benefits from another long postseason journey. View full article
-
The 2025 Postseason Was a Financial Win for the Toronto Blue Jays
Bob Ritchie posted an article in Blue Jays
.jpg.f91d8ba3b4c204a0495abed41fe77b5e.jpg) The Toronto Blue Jays fell short of winning the 2025 World Series, but their lengthy postseason run yielded financial benefits to the players, other personnel, and the team/owner. As Jay Centre’s Leo Morgenstern noted in his article, Details on Blue Jays' Share of Postseason Revenue Pool, Toronto’s players and other employees will share in the $128.2 million players’ pool. The amount allocated to the Blue Jays was $30.8 million. At the club/owner level, there were also financial rewards from the Blue Jays’ postseason journey. From this point forward, unless stated otherwise, any reference to what the Blue Jays received from the postseason run excludes any compensation due to the players or other employees. In other words, the focus is on the financial benefits to the Blue Jays’ company/Rogers Communications. The first reward is Toronto’s share of postseason gate receipts. This number is not currently publicly available, but we can use the $128.2 million players’ pool figure and other publicly available figures to estimate the amount the Blue Jays received in postseason gate receipts. Let’s get started! Below is an excerpt from a 2012 FanGraphs article. My understanding is that the allocation above is accurate except for the Wild Card games. When Wendy Thurm wrote the aforementioned FanGraphs article, the Wild Card round was only one game long, as opposed to the current best-of-three format. Under the current Collective Bargaining Agreement (Article X), players receive 60 percent of paid attendance receipts for the first two games of each Wild Card Series. So, what were the total gate receipts from the 2025 postseason? A back-of-the-envelope calculation is as follows: There were 47 playoff games in 2025, 32 of which were games used to determine the $128.2 million players’ pool amount. Given that the players’ share of the gate receipts is 60% of the games noted in the excerpt, those games are equivalent to 19.2 games (32 games x 0.60). Accordingly, the gate receipts per game are $6.7 million ($128.2 million / 19.2 games). Total gate receipts are the number of games multiplied by the gate receipts per game. Hence, total gate receipts are $314.9 million (47 games x $6.7 million). The Commissioner’s Office would receive $47.2 million ($314.9 million x 0.15). Accordingly, the "teams’ pool" is $139.5 million ($314.9 million - $128.2 million - $47.2 million). However, concerning Toronto’s share of gate receipts, we require a more detailed calculation because postseason teams do not share in the teams’ pool per se. Instead, the two teams in each series share equally in the gate receipts allocated to them. Therefore, a more precise estimate of Toronto’s share of gate receipts requires attendance figures and ticket prices for each series. Onto the tables! Table 1 shows MLB’s 2025 postseason attendance by series. Table 2 presents my estimates of gate receipts by series and the allocation of gate receipts to players, teams, and the Commissioner’s Office. Please note that I increased the average ticket price as the postseason continued. I arbitrarily increased the average Wild Card Series ticket price for the Division Series, Championship Series and World Series by factors of 1.25, 1.50 and 2.00, respectively. I am comfortable with the ticket prices shown because they generated the $128.2 million Players’ Pool figure, and the $316.7 million total gate receipts were within 0.6% of my back-of-the-envelope $314.9 million estimate. Please note that, for each series Toronto played, the teams’ share of gate receipts was split equally between the ballclubs. Accordingly, the Blue Jays shared gate receipts with the Yankees (Division Series), the Mariners (League Championship Series), and the Dodgers (World Series). Hence, Tables 1 and 2, and the supporting numbers, are essential for calculating Toronto’s share of gate receipts. Behold Table 3! Toronto’s share of gate receipts was $48.2 million, comprised of the 20 percent share (50% of 40% or $18.2 million, the sum of Rows A) of gate receipts that were also allocated to the Players’ Pool, and the half-share (50% of 100% or $30.0 million, the sum of Rows B) of the gate receipts distributable to the two teams. Lastly, the fee due to the Commissioner’s Office (15% of $48.2 million or $11.3 million) is deducted, leaving Rogers with a tidy net sum of $36.9 million. In addition to the postseason gate receipts, there are other benefits to the team/Rogers that I cannot calculate. These include increased merchandise, concession, and other game-related revenues attributable to the postseason. Additionally, regular season revenue streams and ticket sales likely increased due to Toronto’s run for the American League East division title. Additionally, 2026 ticket sales should increase due to a successful 2025 regular season and playoff campaign. Lastly, Rogers owns Sportsnet, which holds the Blue Jays' television and radio rights. Although I do not have data to support this claim, Sportsnet’s television ratings, in particular, must have increased substantially, benefiting the broadcaster and, indirectly, Rogers financially. A non-financial reward of the regular season and postseason could be that free agents are viewing the Blue Jays more favourably as a destination. Toronto’s extended playoff run, together with the enthusiastic nationwide fan support during the regular season and playoffs, should make the Blue Jays more attractive. Indeed, money is a significant factor for free agents, but players may view a team that projects to be a well-supported, successful franchise in 2026 more positively. The Last Word For the Toronto Blue Jays and their fans, the 2025 postseason did not culminate in a World Series championship. However, the players and the owner benefited financially from the playoff journey. The players and other employees will participate in their $30.8 million share of the players’ pool. The team/Rogers benefited from an estimated $36.9 million net share of 2025 postseason gate receipts. Other benefits to the team/owner include increased merchandise, concession, and other game-day-related revenue streams. May 2026 bring a World Series championship to the Blue Jays and their fans, as well as more financial benefits from another long postseason journey.
The Toronto Blue Jays fell short of winning the 2025 World Series, but their lengthy postseason run yielded financial benefits to the players, other personnel, and the team/owner. As Jay Centre’s Leo Morgenstern noted in his article, Details on Blue Jays' Share of Postseason Revenue Pool, Toronto’s players and other employees will share in the $128.2 million players’ pool. The amount allocated to the Blue Jays was $30.8 million. At the club/owner level, there were also financial rewards from the Blue Jays’ postseason journey. From this point forward, unless stated otherwise, any reference to what the Blue Jays received from the postseason run excludes any compensation due to the players or other employees. In other words, the focus is on the financial benefits to the Blue Jays’ company/Rogers Communications. The first reward is Toronto’s share of postseason gate receipts. This number is not currently publicly available, but we can use the $128.2 million players’ pool figure and other publicly available figures to estimate the amount the Blue Jays received in postseason gate receipts. Let’s get started! Below is an excerpt from a 2012 FanGraphs article. My understanding is that the allocation above is accurate except for the Wild Card games. When Wendy Thurm wrote the aforementioned FanGraphs article, the Wild Card round was only one game long, as opposed to the current best-of-three format. Under the current Collective Bargaining Agreement (Article X), players receive 60 percent of paid attendance receipts for the first two games of each Wild Card Series. So, what were the total gate receipts from the 2025 postseason? A back-of-the-envelope calculation is as follows: There were 47 playoff games in 2025, 32 of which were games used to determine the $128.2 million players’ pool amount. Given that the players’ share of the gate receipts is 60% of the games noted in the excerpt, those games are equivalent to 19.2 games (32 games x 0.60). Accordingly, the gate receipts per game are $6.7 million ($128.2 million / 19.2 games). Total gate receipts are the number of games multiplied by the gate receipts per game. Hence, total gate receipts are $314.9 million (47 games x $6.7 million). The Commissioner’s Office would receive $47.2 million ($314.9 million x 0.15). Accordingly, the "teams’ pool" is $139.5 million ($314.9 million - $128.2 million - $47.2 million). However, concerning Toronto’s share of gate receipts, we require a more detailed calculation because postseason teams do not share in the teams’ pool per se. Instead, the two teams in each series share equally in the gate receipts allocated to them. Therefore, a more precise estimate of Toronto’s share of gate receipts requires attendance figures and ticket prices for each series. Onto the tables! Table 1 shows MLB’s 2025 postseason attendance by series. Table 2 presents my estimates of gate receipts by series and the allocation of gate receipts to players, teams, and the Commissioner’s Office. Please note that I increased the average ticket price as the postseason continued. I arbitrarily increased the average Wild Card Series ticket price for the Division Series, Championship Series and World Series by factors of 1.25, 1.50 and 2.00, respectively. I am comfortable with the ticket prices shown because they generated the $128.2 million Players’ Pool figure, and the $316.7 million total gate receipts were within 0.6% of my back-of-the-envelope $314.9 million estimate. Please note that, for each series Toronto played, the teams’ share of gate receipts was split equally between the ballclubs. Accordingly, the Blue Jays shared gate receipts with the Yankees (Division Series), the Mariners (League Championship Series), and the Dodgers (World Series). Hence, Tables 1 and 2, and the supporting numbers, are essential for calculating Toronto’s share of gate receipts. Behold Table 3! Toronto’s share of gate receipts was $48.2 million, comprised of the 20 percent share (50% of 40% or $18.2 million, the sum of Rows A) of gate receipts that were also allocated to the Players’ Pool, and the half-share (50% of 100% or $30.0 million, the sum of Rows B) of the gate receipts distributable to the two teams. Lastly, the fee due to the Commissioner’s Office (15% of $48.2 million or $11.3 million) is deducted, leaving Rogers with a tidy net sum of $36.9 million. In addition to the postseason gate receipts, there are other benefits to the team/Rogers that I cannot calculate. These include increased merchandise, concession, and other game-related revenues attributable to the postseason. Additionally, regular season revenue streams and ticket sales likely increased due to Toronto’s run for the American League East division title. Additionally, 2026 ticket sales should increase due to a successful 2025 regular season and playoff campaign. Lastly, Rogers owns Sportsnet, which holds the Blue Jays' television and radio rights. Although I do not have data to support this claim, Sportsnet’s television ratings, in particular, must have increased substantially, benefiting the broadcaster and, indirectly, Rogers financially. A non-financial reward of the regular season and postseason could be that free agents are viewing the Blue Jays more favourably as a destination. Toronto’s extended playoff run, together with the enthusiastic nationwide fan support during the regular season and playoffs, should make the Blue Jays more attractive. Indeed, money is a significant factor for free agents, but players may view a team that projects to be a well-supported, successful franchise in 2026 more positively. The Last Word For the Toronto Blue Jays and their fans, the 2025 postseason did not culminate in a World Series championship. However, the players and the owner benefited financially from the playoff journey. The players and other employees will participate in their $30.8 million share of the players’ pool. The team/Rogers benefited from an estimated $36.9 million net share of 2025 postseason gate receipts. Other benefits to the team/owner include increased merchandise, concession, and other game-day-related revenue streams. May 2026 bring a World Series championship to the Blue Jays and their fans, as well as more financial benefits from another long postseason journey. -
Pat Gillick many times recounted his wife's reaction to the big 1990 trade. Fred McGriff was Doris Gillick's favourite player. Before the deal was announced publicly, Pat called Doris to tell her about the deal, particularly the inclusion of McGriff. Doris, after a long pause, replied, “Why don’t you get home as soon as possible before you screw up the team anymore?” https://www.mlb.com/news/padres-biggest-winter-meetings-moves
- 1 reply
-
- 1
-

-
- dc analysis
- roger clemens
- (and 3 more)
-
There are two ways former MLB players can be elected to the National Baseball Hall of Fame. The first is the annual election conducted by the Baseball Writers’ Association of America (“BBWAA”). The second is selection by an Era Committee, formerly known as the Veterans Committee. Of the 278 former major league players who are members of the Hall of Fame, 117 were elected by an Era/Veterans Committee. This year's Era Committee will officially announce the election results on December 7, 2025. Concerning the BBWAA’s election, an eligible player’s name must appear on at least 75% of the BBWAA ballots cast in a given year to become a Hall of Fame member. The BBWAA removes a candidate from future ballots if either the candidate’s name appeared on fewer than five percent of the ballots or the player was on the ballot for 10 years but did not meet the 75% condition. Delgado’s name initially appeared on the BBWAA’s ballot in 2015. Unfortunately, his name appeared on only 3.8% of ballots cast, and the BBWAA removed him from future ballots. Now, for the first time, Delgado is on a Contemporary Baseball Era Committee ballot, for the Hall of Fame class of 2026. To gain entrance into the Hall, Delgado’s name must appear on at least 12 of the 16 Era Committee ballots cast. Delgado played 17 seasons, 12 with the Blue Jays (1993-2004), one with the Marlins (2005) and four with the Mets (2006-2009). He posted a 135 wRC+ and a 44.4 bWAR. Other highlights from his career include the following: His wRC+ was 19th among the 162 players who played during his career (1993-2009) and had at least 5,000 plate appearances. Concerning first basemen, Delgado’s wRC+ was the eighth highest, and, notably, five of the seven first basemen ahead of Delgado are Hall of Famers (or future Hall of Famers, in the case of Albert Pujols). Delgado hit 473 home runs, which is 34th all-time. Among players whose careers began after 1979, his home run total ranks #16 overall and eighth among first basemen. In four seasons, Delgado finished in the top 10 of MVP voting: 2000 (4th), 2003 (2nd), 2005 (6th) and 2008 (9th). He won three Silver Slugger Awards (1999, 2000 and 2003). Delgado had two seasons in which his bWAR was in the top 10 among position players (2000 and 2003). Delgado’s last full MLB season was 2008, his age-36 campaign. He generated a 123 wRC+ with 38 home runs and a 1.3 bWAR. In 2009, he played 26 games, but did not play after May 10 due to a hip injury. Subsequently, Delgado underwent two hip surgeries. He attempted a comeback in 2010 with Boston’s Triple-A affiliate, but after five games, he called an end to the comeback and his MLB career. Delgado was not known for his defence. As a first baseman, his Total Zone per 1,200 innings was -2. That is inferior to Don Mattingly’s +3, and many MLB observers considered Mattingly to be a premier defender at first base. I wrote about Mattingly's candidacy earlier this week; the former Blue Jays bench coach is on the same Hall of Fame ballot as Delgado. Concerning dWAR, the career marks of Delgado and Mattingly are -17.2 and -6.2, respectively. Delgado’s best case for Hall of Fame membership is his home run total. Of the 33 players with more home runs, 24 are Hall of Famers, seven were linked with performance-enhancing drugs (Barry Bonds et al.) and have yet to be elected to the Hall of Fame, and two are almost-certain Hall of Fame members (Albert Pujols and Miguel Cabrera). If the Era Committee does not elect Delgado to the Hall of Fame, he will be the only non-PED-linked name among the top 34 home run hitters not in the Hall. Onto the bWAR numbers! Three bWAR-based metrics are valuable for evaluating whether a player has earned Hall of Fame membership: bWAR, WAR7, and JAWS. bWAR does not require explanation, but WAR7 and JAWS do. One of the limitations of career bWAR is that a Hall of Fame candidate may have generated a high bWAR because they had a lengthy career. Since a Hall of Famer should be one of the best at their position over multiple seasons, WAR7, the total of a player’s seven highest bWAR seasons, is informative because it measures dominance across many years. JAWS, developed by Jay Jaffe, is the average of bWAR and WAR7, and it is instructive because it balances these two metrics (bWAR and WAR7). Jaffe, now of FanGraphs, wrote an excellent article about Delgado’s Hall of Fame candidacy. However, as with Mattingly, it is the bWAR-related metrics that most hurt Delgado’s Hall of Fame candidacy. In addition to Delgado, Table 1 shows the career bWAR marks of the top 15 first basemen whose MLB careers began after 1979. Delgado’s bWAR, WAR7 and JAWS numbers are noticeably below the average of the Hall of Famers on the list (Jeff Bagwell, Frank Thomas, Jim Thome, Todd Helton, Fred McGriff, and David Ortiz). Of these Hall of Fame members, McGriff was the only one voted in by an Era Committee. Delgado’s bWAR, WAR7 and JAWS marks are 44.4, 34.5 and 39.4, which rank 19th, 21st and 18th, respectively. Concerning the all-time Hall of Fame list, there are 25 first basemen. Their average bWAR, WAR7 and JAWS are 65.0, 42.0 and 53.5, respectively. Furthermore, among all first basemen, Delgado’s bWAR and WAR7 rank 40th, and his JAWS slots in at #38. Circling back to Table 1, Delgado’s WAR7, like Mattingly's, is similar to those of Ortiz and McGriff. So, should he be in the Hall of Fame? The answer is no, because Hall of Fame membership should be exclusive and reserved for those who were clearly the best of their era at their position. In other words, the entrance bar should be set high. The Hall of Fame candidacies of Ortiz and McGriff were marginal. The bar should not be lowered further to grant Hall of Fame access to Delgado or Mattingly. The Last Word The threshold to be a Hall of Famer should be set high. Although Delgado’s home run total is impressive, there should be more than one aspect of hitting, no matter how important that one aspect is, that vaults a player into the Hall. Delgado’s all-around game, as measured by bWAR-related metrics, places him, like many players, in the Hall of Very Good, not the Hall of Fame. View full article
-
Should Former Toronto Blue Jay Carlos Delgado Be a Hall of Famer?
Bob Ritchie posted an article in Blue Jays
.jpg.7f99723b64b5fd2400668a9217b5567c.jpg) There are two ways former MLB players can be elected to the National Baseball Hall of Fame. The first is the annual election conducted by the Baseball Writers’ Association of America (“BBWAA”). The second is selection by an Era Committee, formerly known as the Veterans Committee. Of the 278 former major league players who are members of the Hall of Fame, 117 were elected by an Era/Veterans Committee. This year's Era Committee will officially announce the election results on December 7, 2025. Concerning the BBWAA’s election, an eligible player’s name must appear on at least 75% of the BBWAA ballots cast in a given year to become a Hall of Fame member. The BBWAA removes a candidate from future ballots if either the candidate’s name appeared on fewer than five percent of the ballots or the player was on the ballot for 10 years but did not meet the 75% condition. Delgado’s name initially appeared on the BBWAA’s ballot in 2015. Unfortunately, his name appeared on only 3.8% of ballots cast, and the BBWAA removed him from future ballots. Now, for the first time, Delgado is on a Contemporary Baseball Era Committee ballot, for the Hall of Fame class of 2026. To gain entrance into the Hall, Delgado’s name must appear on at least 12 of the 16 Era Committee ballots cast. Delgado played 17 seasons, 12 with the Blue Jays (1993-2004), one with the Marlins (2005) and four with the Mets (2006-2009). He posted a 135 wRC+ and a 44.4 bWAR. Other highlights from his career include the following: His wRC+ was 19th among the 162 players who played during his career (1993-2009) and had at least 5,000 plate appearances. Concerning first basemen, Delgado’s wRC+ was the eighth highest, and, notably, five of the seven first basemen ahead of Delgado are Hall of Famers (or future Hall of Famers, in the case of Albert Pujols). Delgado hit 473 home runs, which is 34th all-time. Among players whose careers began after 1979, his home run total ranks #16 overall and eighth among first basemen. In four seasons, Delgado finished in the top 10 of MVP voting: 2000 (4th), 2003 (2nd), 2005 (6th) and 2008 (9th). He won three Silver Slugger Awards (1999, 2000 and 2003). Delgado had two seasons in which his bWAR was in the top 10 among position players (2000 and 2003). Delgado’s last full MLB season was 2008, his age-36 campaign. He generated a 123 wRC+ with 38 home runs and a 1.3 bWAR. In 2009, he played 26 games, but did not play after May 10 due to a hip injury. Subsequently, Delgado underwent two hip surgeries. He attempted a comeback in 2010 with Boston’s Triple-A affiliate, but after five games, he called an end to the comeback and his MLB career. Delgado was not known for his defence. As a first baseman, his Total Zone per 1,200 innings was -2. That is inferior to Don Mattingly’s +3, and many MLB observers considered Mattingly to be a premier defender at first base. I wrote about Mattingly's candidacy earlier this week; the former Blue Jays bench coach is on the same Hall of Fame ballot as Delgado. Concerning dWAR, the career marks of Delgado and Mattingly are -17.2 and -6.2, respectively. Delgado’s best case for Hall of Fame membership is his home run total. Of the 33 players with more home runs, 24 are Hall of Famers, seven were linked with performance-enhancing drugs (Barry Bonds et al.) and have yet to be elected to the Hall of Fame, and two are almost-certain Hall of Fame members (Albert Pujols and Miguel Cabrera). If the Era Committee does not elect Delgado to the Hall of Fame, he will be the only non-PED-linked name among the top 34 home run hitters not in the Hall. Onto the bWAR numbers! Three bWAR-based metrics are valuable for evaluating whether a player has earned Hall of Fame membership: bWAR, WAR7, and JAWS. bWAR does not require explanation, but WAR7 and JAWS do. One of the limitations of career bWAR is that a Hall of Fame candidate may have generated a high bWAR because they had a lengthy career. Since a Hall of Famer should be one of the best at their position over multiple seasons, WAR7, the total of a player’s seven highest bWAR seasons, is informative because it measures dominance across many years. JAWS, developed by Jay Jaffe, is the average of bWAR and WAR7, and it is instructive because it balances these two metrics (bWAR and WAR7). Jaffe, now of FanGraphs, wrote an excellent article about Delgado’s Hall of Fame candidacy. However, as with Mattingly, it is the bWAR-related metrics that most hurt Delgado’s Hall of Fame candidacy. In addition to Delgado, Table 1 shows the career bWAR marks of the top 15 first basemen whose MLB careers began after 1979. Delgado’s bWAR, WAR7 and JAWS numbers are noticeably below the average of the Hall of Famers on the list (Jeff Bagwell, Frank Thomas, Jim Thome, Todd Helton, Fred McGriff, and David Ortiz). Of these Hall of Fame members, McGriff was the only one voted in by an Era Committee. Delgado’s bWAR, WAR7 and JAWS marks are 44.4, 34.5 and 39.4, which rank 19th, 21st and 18th, respectively. Concerning the all-time Hall of Fame list, there are 25 first basemen. Their average bWAR, WAR7 and JAWS are 65.0, 42.0 and 53.5, respectively. Furthermore, among all first basemen, Delgado’s bWAR and WAR7 rank 40th, and his JAWS slots in at #38. Circling back to Table 1, Delgado’s WAR7, like Mattingly's, is similar to those of Ortiz and McGriff. So, should he be in the Hall of Fame? The answer is no, because Hall of Fame membership should be exclusive and reserved for those who were clearly the best of their era at their position. In other words, the entrance bar should be set high. The Hall of Fame candidacies of Ortiz and McGriff were marginal. The bar should not be lowered further to grant Hall of Fame access to Delgado or Mattingly. The Last Word The threshold to be a Hall of Famer should be set high. Although Delgado’s home run total is impressive, there should be more than one aspect of hitting, no matter how important that one aspect is, that vaults a player into the Hall. Delgado’s all-around game, as measured by bWAR-related metrics, places him, like many players, in the Hall of Very Good, not the Hall of Fame.
There are two ways former MLB players can be elected to the National Baseball Hall of Fame. The first is the annual election conducted by the Baseball Writers’ Association of America (“BBWAA”). The second is selection by an Era Committee, formerly known as the Veterans Committee. Of the 278 former major league players who are members of the Hall of Fame, 117 were elected by an Era/Veterans Committee. This year's Era Committee will officially announce the election results on December 7, 2025. Concerning the BBWAA’s election, an eligible player’s name must appear on at least 75% of the BBWAA ballots cast in a given year to become a Hall of Fame member. The BBWAA removes a candidate from future ballots if either the candidate’s name appeared on fewer than five percent of the ballots or the player was on the ballot for 10 years but did not meet the 75% condition. Delgado’s name initially appeared on the BBWAA’s ballot in 2015. Unfortunately, his name appeared on only 3.8% of ballots cast, and the BBWAA removed him from future ballots. Now, for the first time, Delgado is on a Contemporary Baseball Era Committee ballot, for the Hall of Fame class of 2026. To gain entrance into the Hall, Delgado’s name must appear on at least 12 of the 16 Era Committee ballots cast. Delgado played 17 seasons, 12 with the Blue Jays (1993-2004), one with the Marlins (2005) and four with the Mets (2006-2009). He posted a 135 wRC+ and a 44.4 bWAR. Other highlights from his career include the following: His wRC+ was 19th among the 162 players who played during his career (1993-2009) and had at least 5,000 plate appearances. Concerning first basemen, Delgado’s wRC+ was the eighth highest, and, notably, five of the seven first basemen ahead of Delgado are Hall of Famers (or future Hall of Famers, in the case of Albert Pujols). Delgado hit 473 home runs, which is 34th all-time. Among players whose careers began after 1979, his home run total ranks #16 overall and eighth among first basemen. In four seasons, Delgado finished in the top 10 of MVP voting: 2000 (4th), 2003 (2nd), 2005 (6th) and 2008 (9th). He won three Silver Slugger Awards (1999, 2000 and 2003). Delgado had two seasons in which his bWAR was in the top 10 among position players (2000 and 2003). Delgado’s last full MLB season was 2008, his age-36 campaign. He generated a 123 wRC+ with 38 home runs and a 1.3 bWAR. In 2009, he played 26 games, but did not play after May 10 due to a hip injury. Subsequently, Delgado underwent two hip surgeries. He attempted a comeback in 2010 with Boston’s Triple-A affiliate, but after five games, he called an end to the comeback and his MLB career. Delgado was not known for his defence. As a first baseman, his Total Zone per 1,200 innings was -2. That is inferior to Don Mattingly’s +3, and many MLB observers considered Mattingly to be a premier defender at first base. I wrote about Mattingly's candidacy earlier this week; the former Blue Jays bench coach is on the same Hall of Fame ballot as Delgado. Concerning dWAR, the career marks of Delgado and Mattingly are -17.2 and -6.2, respectively. Delgado’s best case for Hall of Fame membership is his home run total. Of the 33 players with more home runs, 24 are Hall of Famers, seven were linked with performance-enhancing drugs (Barry Bonds et al.) and have yet to be elected to the Hall of Fame, and two are almost-certain Hall of Fame members (Albert Pujols and Miguel Cabrera). If the Era Committee does not elect Delgado to the Hall of Fame, he will be the only non-PED-linked name among the top 34 home run hitters not in the Hall. Onto the bWAR numbers! Three bWAR-based metrics are valuable for evaluating whether a player has earned Hall of Fame membership: bWAR, WAR7, and JAWS. bWAR does not require explanation, but WAR7 and JAWS do. One of the limitations of career bWAR is that a Hall of Fame candidate may have generated a high bWAR because they had a lengthy career. Since a Hall of Famer should be one of the best at their position over multiple seasons, WAR7, the total of a player’s seven highest bWAR seasons, is informative because it measures dominance across many years. JAWS, developed by Jay Jaffe, is the average of bWAR and WAR7, and it is instructive because it balances these two metrics (bWAR and WAR7). Jaffe, now of FanGraphs, wrote an excellent article about Delgado’s Hall of Fame candidacy. However, as with Mattingly, it is the bWAR-related metrics that most hurt Delgado’s Hall of Fame candidacy. In addition to Delgado, Table 1 shows the career bWAR marks of the top 15 first basemen whose MLB careers began after 1979. Delgado’s bWAR, WAR7 and JAWS numbers are noticeably below the average of the Hall of Famers on the list (Jeff Bagwell, Frank Thomas, Jim Thome, Todd Helton, Fred McGriff, and David Ortiz). Of these Hall of Fame members, McGriff was the only one voted in by an Era Committee. Delgado’s bWAR, WAR7 and JAWS marks are 44.4, 34.5 and 39.4, which rank 19th, 21st and 18th, respectively. Concerning the all-time Hall of Fame list, there are 25 first basemen. Their average bWAR, WAR7 and JAWS are 65.0, 42.0 and 53.5, respectively. Furthermore, among all first basemen, Delgado’s bWAR and WAR7 rank 40th, and his JAWS slots in at #38. Circling back to Table 1, Delgado’s WAR7, like Mattingly's, is similar to those of Ortiz and McGriff. So, should he be in the Hall of Fame? The answer is no, because Hall of Fame membership should be exclusive and reserved for those who were clearly the best of their era at their position. In other words, the entrance bar should be set high. The Hall of Fame candidacies of Ortiz and McGriff were marginal. The bar should not be lowered further to grant Hall of Fame access to Delgado or Mattingly. The Last Word The threshold to be a Hall of Famer should be set high. Although Delgado’s home run total is impressive, there should be more than one aspect of hitting, no matter how important that one aspect is, that vaults a player into the Hall. Delgado’s all-around game, as measured by bWAR-related metrics, places him, like many players, in the Hall of Very Good, not the Hall of Fame.
.jpg.5114cbe747dff3442088d6a30a951534.jpg)
.jpg.97d64c1b98e7d600951d5ee04f9afe10.jpg)


.jpg.72e1bd44e4908baa4817b00a0de26f58.jpg)
.jpg.f91d8ba3b4c204a0495abed41fe77b5e.jpg)

.jpg.7f99723b64b5fd2400668a9217b5567c.jpg)