


Bob Ritchie
-
Posts
121 -
Joined
-
Last visited
-
Days Won
1
1 Follower

Bob Ritchie's Achievements






-
Andrés Giménez has been an elite shortstop defensively this season. As of September 1, in 1,025 innings, he has posted a +15 Fielding Run Value (“FRV”) that trails only Kansas City’s Bobby Witt Jr.’s +18 FRV score. For the Blue Jays, this is a significant improvement over Bo Bichette’s -28 FRV in 6,184 innings from 2019 to 2025. During those seven seasons, of 92 qualified shortstops, only CJ Abrams posted a worse FRV mark (-38). On a number-of-innings-equivalent basis, Bichette’s FRV per 1,025 innings was -5. In other words, compared to the equivalent-innings defensive performance of Bichette, the 2026 Blue Jays have picked up 20 runs (+15 versus -5), which is worth approximately two wins, from Giménez’s defence at short. When it comes to hitting, did I mention that Giménez is an elite defender? Well, okay, Giménez has been well below average at the plate this season. His 78 wRC+ ranks 34th among the 40 shortstops with at least 200 plate appearances in 2026. Also, his OBP ranks 35th, and his K-BB% and ISO are each 32nd among this shortstop group. Overall, since producing a 143 wRC+ in 2022, Giménez's wRC+ has been 84. It is safe to say hitting is not his strong suit. In fact, as Jays Centre’s Leo Morgenstern noted in a recent Slack post, if Giménez records the highest fWAR this season among Toronto’s position players (he currently leads with a 2.5 fWAR), he will have the lowest wRC+ of any player who led the Blue Jays in fWAR in a single season. Before this season, Damaso Garcia held the Highest fWAR-Lowest wRC+ title due to his 3.8 fWAR and 98 wRC+ in 1982. For the record, the holder of the Highest fWAR-Highest wRC+ title is José Bautista, who posted a 180 wRC+ and led the 2011 Blue Jays with an 8.1 fWAR. To the question of whether the Blue Jays can enter next season with a well-below-average hitter as an everyday shortstop, there are three factors to consider. First, suppose Toronto desires to be a Top Five hitting team in 2027. Accordingly, do Top Five hitting teams have weak hitters as regular-playing-time players? If so, how many? Second, what if Toronto wants a better hitter as its everyday shortstop? Who are the options to replace Giménez? Third, are there opportunities to improve second base with a better bat? Currently, Toronto’s second basemen have produced an 89 wRC+, which ranks 24th among MLB teams. Regarding the composition of better-hitting teams, as measured by wRC+, see the table below. Averages of the Top 5 Teams by wRC+ Season # of Players with 200 or More Plate Appearances & wRC+ Greater Than Ranked by Plate Appearances # of Players with wRC+ Greater Than 100 100 125 150 Top 6 Top 7 Top 8 Top 9 2025 8 4 1 5 6 6 7 2024 8 3 1 5 6 7 7 2023 8 5 2 5 6 7 8 2022 7 5 1 5 6 7 7 2021 9 4 1 5 6 7 7 Average 2021 to 2025 8 4 1 5 6 7 7 2025 Jays 8 3 1 5 6 6 6 2026 Jays 4 0 0 2 2 3 3 Source: FanGraphs. The 2026 data is as of September 1, 2026. I constructed the table as follows: For each of the seasons from 2021 to 2025, I selected the five best-hitting teams by wRC+. The sample for each team includes any batter with at least 200 plate appearances with the listed team. For each team, the hitters were ranked from most to fewest plate appearances. On average, hitters with at least 200 plate appearances accounted for 86% of a team’s total plate appearances, and 89% of a team’s wRC+ (weighted by plate appearances). My observations are as follows: During the five years from 2021 to 2025, the Top Five hitting teams averaged eight batters with wRC+ marks greater than 100, four of whom had wRC+ scores more than 125, and one of the four posted a wRC+ greater than 150. On average, after sorting the players by most plate appearances, these teams had five hitters with wRC+ figures more than 100 in their top six, six players in their top seven and seven in their top eight and top nine. Accordingly, even the best-hitting ballclubs have below-average hitters in their regular lineup. For example, in 2025, Toronto had the second-highest wRC+ (113), and its hitters with the eighth- and ninth-most plate appearances were Giménez and Myles Straw. These batters posted wRC+ numbers of 71 and 91, respectively. Furthermore, Ernie Clement had the third-most plate appearances of the 2025 Blue Jays, and he recorded a 98 wRC+. Compared to the averages shown of the best-hitting teams during the 2021-2025 seasons, the 2025 Blue Jays’ numbers were similar. That version of the Blue Jays had eight batters with wRC+ marks above 100, three above 125, and one above 150. Of the top nine leaders by plate appearances, six posted wRC+ numbers more than 100. Therefore, a team can be among the best-hitting ballclubs and still have regulars who are below-average batters. As of September 1, the 2026 Blue Jays had generated a 93 wRC+, which ranks 26th. As the table shows, Toronto only has four batters with wRC+ scores in excess of 100 and only two in the top six batters by plate appearances. What does all this mean for the 2027 Blue Jays? First, Toronto can have Giménez, an elite shortstop defensively but a below-average hitter, play every day. However, Toronto will have to surround Giménez with above-average hitters. Part of the solution could be internal: a bounce-back season from Vladimir Guerrero Jr., the return of Addison Barger and Anthony Santander, and better seasons from Kazuma Okamoto and Alejandro Kirk. Perhaps Charles McAdoo and Brett Bateman could take their hitting to a higher level. Concerning the middle infield, there are external options. The trade market and internal candidates are possibilities, but I will focus on the list of scheduled 2027 free agents. One option is for Toronto to sign a free agent shortstop who hits better than Giménez. Accordingly, Giménez would move to second base, where he posted a +7 FRV in 720 innings in 2025. Unfortunately, according to Spotrac, there are slim pickings from the list of 2027 free agent shortstops. Would an Isiah Kiner-Falefa improve Toronto’s hitting? I will say no. On the bright side, there are interesting free agents among second basemen. This article isn't the place to take a deep dive into these players, but Jazz Chisholm Jr. and Brandon Lowe are intriguing. Chisholm is having a down year offensively (99 wRC+), but he has a 3.4 fWAR, a .175 ISO and a +7 FRV. Thus far in 2026, Lowe has posted a 115 wRC+, a 3.9 fWAR, a .227 ISO and a +10 FRV. Luis Arraez and Gleyber Torres are also options. The pool of 2027 free agent second basemen could be a worthwhile option for Toronto’s front office to consider. The Last Word Before the 2026 campaign began, I forecast that Giménez would steal 25 or more bases and also generate a wRC+ greater than 114. As of September 3, he has 20 stolen bases and can still exceed 25. Concerning my wRC+ prediction, let’s say I was just a bit outside the mark. Nevertheless, Giménez provides the Blue Jays with elite defence at an important position. Furthermore, even top-hitting teams carry below-average hitters as everyday players. The key is to surround players like Giménez with better-than-average hitters. Overall, the 2027 Blue Jays can approach the lofty heights of a Top Five hitting team through internal improvement from players such as Guerrero and the return of Barger and Santander. Also, while the 2027 free agent shortstop class does not have much to desire offensively, the 2027 free agent second basemen group is attractive. An addition such as Chisolm or Lowe would improve Toronto’s offence and also be a positive contributor defensively. So, should the Blue Jays enter next season with Giménez, a light-hitting, defensively elite everyday shortstop? The answer is yes! View full article
-
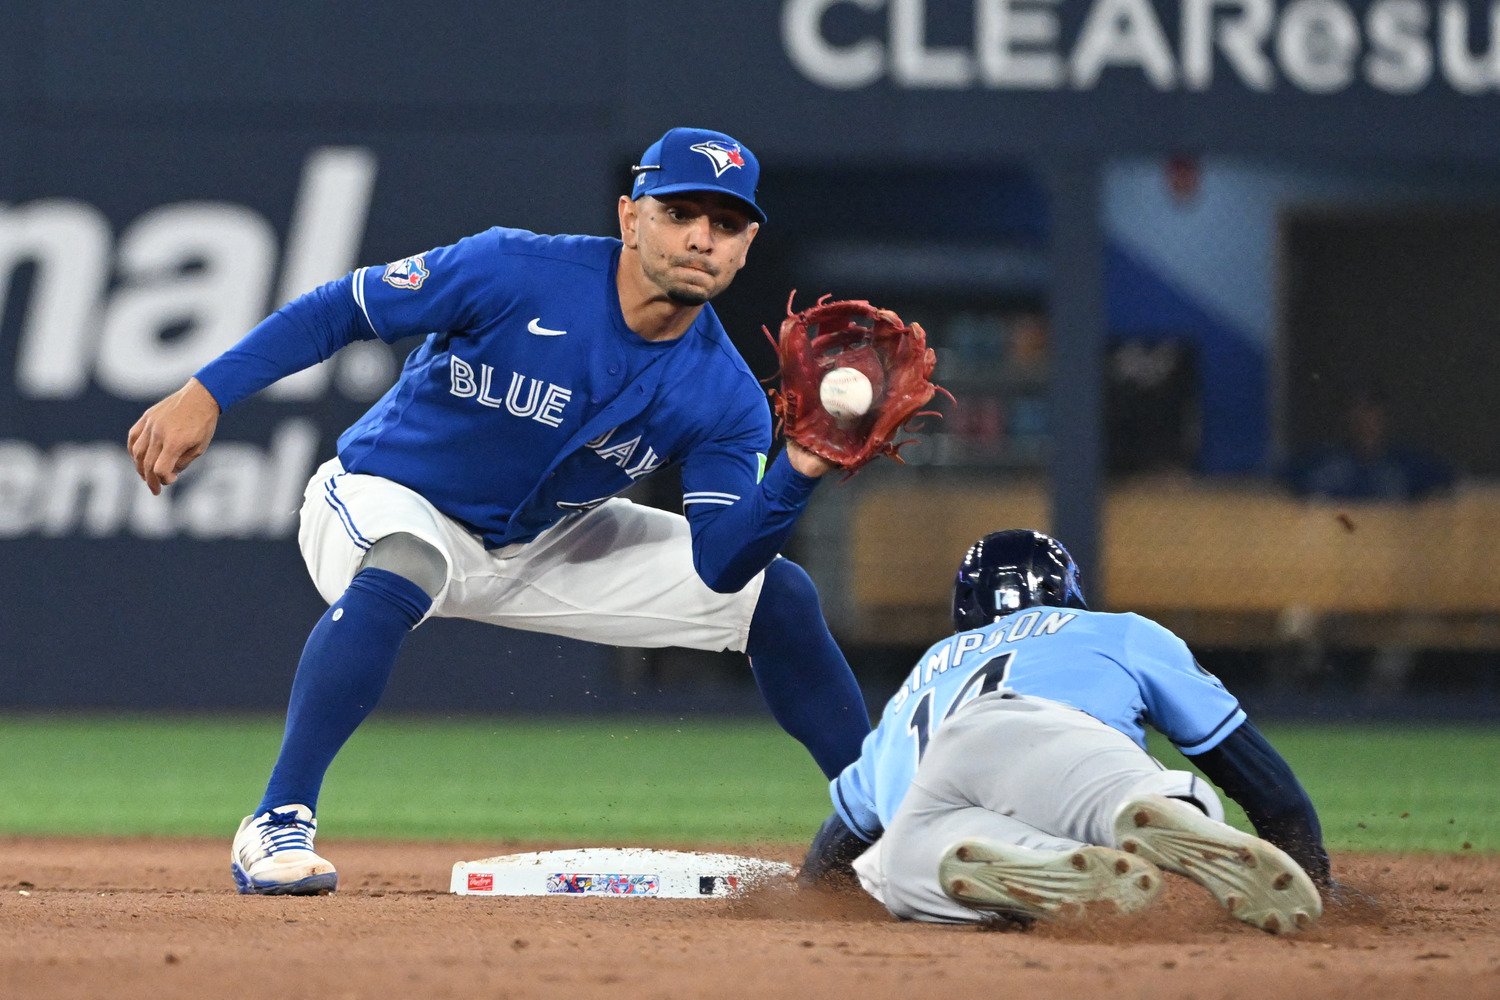 Andrés Giménez has been an elite shortstop defensively this season. As of September 1, in 1,025 innings, he has posted a +15 Fielding Run Value (“FRV”) that trails only Kansas City’s Bobby Witt Jr.’s +18 FRV score. For the Blue Jays, this is a significant improvement over Bo Bichette’s -28 FRV in 6,184 innings from 2019 to 2025. During those seven seasons, of 92 qualified shortstops, only CJ Abrams posted a worse FRV mark (-38). On a number-of-innings-equivalent basis, Bichette’s FRV per 1,025 innings was -5. In other words, compared to the equivalent-innings defensive performance of Bichette, the 2026 Blue Jays have picked up 20 runs (+15 versus -5), which is worth approximately two wins, from Giménez’s defence at short. When it comes to hitting, did I mention that Giménez is an elite defender? Well, okay, Giménez has been well below average at the plate this season. His 78 wRC+ ranks 34th among the 40 shortstops with at least 200 plate appearances in 2026. Also, his OBP ranks 35th, and his K-BB% and ISO are each 32nd among this shortstop group. Overall, since producing a 143 wRC+ in 2022, Giménez's wRC+ has been 84. It is safe to say hitting is not his strong suit. In fact, as Jays Centre’s Leo Morgenstern noted in a recent Slack post, if Giménez records the highest fWAR this season among Toronto’s position players (he currently leads with a 2.5 fWAR), he will have the lowest wRC+ of any player who led the Blue Jays in fWAR in a single season. Before this season, Damaso Garcia held the Highest fWAR-Lowest wRC+ title due to his 3.8 fWAR and 98 wRC+ in 1982. For the record, the holder of the Highest fWAR-Highest wRC+ title is José Bautista, who posted a 180 wRC+ and led the 2011 Blue Jays with an 8.1 fWAR. To the question of whether the Blue Jays can enter next season with a well-below-average hitter as an everyday shortstop, there are three factors to consider. First, suppose Toronto desires to be a Top Five hitting team in 2027. Accordingly, do Top Five hitting teams have weak hitters as regular-playing-time players? If so, how many? Second, what if Toronto wants a better hitter as its everyday shortstop? Who are the options to replace Giménez? Third, are there opportunities to improve second base with a better bat? Currently, Toronto’s second basemen have produced an 89 wRC+, which ranks 24th among MLB teams. Regarding the composition of better-hitting teams, as measured by wRC+, see the table below. Averages of the Top 5 Teams by wRC+ Season # of Players with 200 or More Plate Appearances & wRC+ Greater Than Ranked by Plate Appearances # of Players with wRC+ Greater Than 100 100 125 150 Top 6 Top 7 Top 8 Top 9 2025 8 4 1 5 6 6 7 2024 8 3 1 5 6 7 7 2023 8 5 2 5 6 7 8 2022 7 5 1 5 6 7 7 2021 9 4 1 5 6 7 7 Average 2021 to 2025 8 4 1 5 6 7 7 2025 Jays 8 3 1 5 6 6 6 2026 Jays 4 0 0 2 2 3 3 Source: FanGraphs. The 2026 data is as of September 1, 2026. I constructed the table as follows: For each of the seasons from 2021 to 2025, I selected the five best-hitting teams by wRC+. The sample for each team includes any batter with at least 200 plate appearances with the listed team. For each team, the hitters were ranked from most to fewest plate appearances. On average, hitters with at least 200 plate appearances accounted for 86% of a team’s total plate appearances, and 89% of a team’s wRC+ (weighted by plate appearances). My observations are as follows: During the five years from 2021 to 2025, the Top Five hitting teams averaged eight batters with wRC+ marks greater than 100, four of whom had wRC+ scores more than 125, and one of the four posted a wRC+ greater than 150. On average, after sorting the players by most plate appearances, these teams had five hitters with wRC+ figures more than 100 in their top six, six players in their top seven and seven in their top eight and top nine. Accordingly, even the best-hitting ballclubs have below-average hitters in their regular lineup. For example, in 2025, Toronto had the second-highest wRC+ (113), and its hitters with the eighth- and ninth-most plate appearances were Giménez and Myles Straw. These batters posted wRC+ numbers of 71 and 91, respectively. Furthermore, Ernie Clement had the third-most plate appearances of the 2025 Blue Jays, and he recorded a 98 wRC+. Compared to the averages shown of the best-hitting teams during the 2021-2025 seasons, the 2025 Blue Jays’ numbers were similar. That version of the Blue Jays had eight batters with wRC+ marks above 100, three above 125, and one above 150. Of the top nine leaders by plate appearances, six posted wRC+ numbers more than 100. Therefore, a team can be among the best-hitting ballclubs and still have regulars who are below-average batters. As of September 1, the 2026 Blue Jays had generated a 93 wRC+, which ranks 26th. As the table shows, Toronto only has four batters with wRC+ scores in excess of 100 and only two in the top six batters by plate appearances. What does all this mean for the 2027 Blue Jays? First, Toronto can have Giménez, an elite shortstop defensively but a below-average hitter, play every day. However, Toronto will have to surround Giménez with above-average hitters. Part of the solution could be internal: a bounce-back season from Vladimir Guerrero Jr., the return of Addison Barger and Anthony Santander, and better seasons from Kazuma Okamoto and Alejandro Kirk. Perhaps Charles McAdoo and Brett Bateman could take their hitting to a higher level. Concerning the middle infield, there are external options. The trade market and internal candidates are possibilities, but I will focus on the list of scheduled 2027 free agents. One option is for Toronto to sign a free agent shortstop who hits better than Giménez. Accordingly, Giménez would move to second base, where he posted a +7 FRV in 720 innings in 2025. Unfortunately, according to Spotrac, there are slim pickings from the list of 2027 free agent shortstops. Would an Isiah Kiner-Falefa improve Toronto’s hitting? I will say no. On the bright side, there are interesting free agents among second basemen. This article isn't the place to take a deep dive into these players, but Jazz Chisholm Jr. and Brandon Lowe are intriguing. Chisholm is having a down year offensively (99 wRC+), but he has a 3.4 fWAR, a .175 ISO and a +7 FRV. Thus far in 2026, Lowe has posted a 115 wRC+, a 3.9 fWAR, a .227 ISO and a +10 FRV. Luis Arraez and Gleyber Torres are also options. The pool of 2027 free agent second basemen could be a worthwhile option for Toronto’s front office to consider. The Last Word Before the 2026 campaign began, I forecast that Giménez would steal 25 or more bases and also generate a wRC+ greater than 114. As of September 3, he has 20 stolen bases and can still exceed 25. Concerning my wRC+ prediction, let’s say I was just a bit outside the mark. Nevertheless, Giménez provides the Blue Jays with elite defence at an important position. Furthermore, even top-hitting teams carry below-average hitters as everyday players. The key is to surround players like Giménez with better-than-average hitters. Overall, the 2027 Blue Jays can approach the lofty heights of a Top Five hitting team through internal improvement from players such as Guerrero and the return of Barger and Santander. Also, while the 2027 free agent shortstop class does not have much to desire offensively, the 2027 free agent second basemen group is attractive. An addition such as Chisolm or Lowe would improve Toronto’s offence and also be a positive contributor defensively. So, should the Blue Jays enter next season with Giménez, a light-hitting, defensively elite everyday shortstop? The answer is yes!
 -
 Jesse Burrill reacted to a post in a topic:
George Springer's Recent Resurgence Is More Complicated Than It Looks
Jesse Burrill reacted to a post in a topic:
George Springer's Recent Resurgence Is More Complicated Than It Looks
-
 Spanky__99 reacted to a post in a topic:
George Springer's Recent Resurgence Is More Complicated Than It Looks
Spanky__99 reacted to a post in a topic:
George Springer's Recent Resurgence Is More Complicated Than It Looks
-
Jesse, good stuff!
-
Bob Ritchie reacted to an article:
George Springer's Recent Resurgence Is More Complicated Than It Looks
-
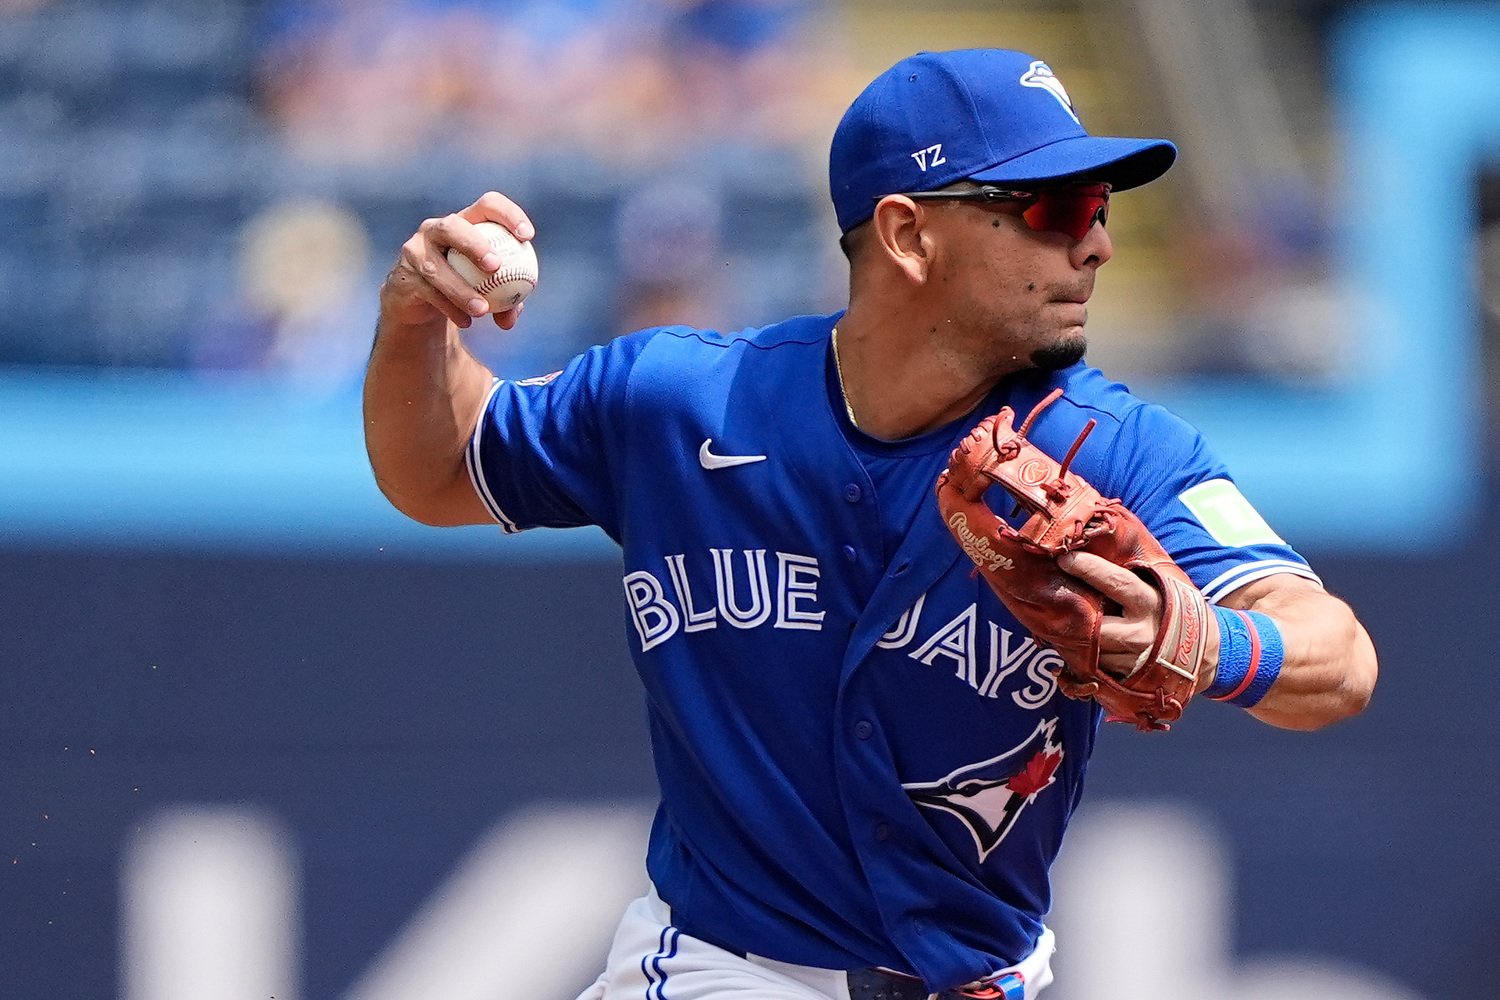 During recent offseasons, the Toronto Blue Jays have made acquisitions that emphasized top-tier defence. For example, they added Daulton Varsho, Kevin Kiermaier, Matt Chapman, Andrés Giménez and Myles Straw. In terms of total Fielding Run Value (“FRV”), Toronto ranked seventh in 2023 and first in both 2024 and 2025. This season, because the Blue Jays’ offence is poor (27th in wRC+ and 28th in runs), superior defence is critical if Toronto is to capture a place in the postseason. To that end, as of August 15, 2026, the Blue Jays posted a +34 FRV total, the second-highest in MLB. However, before the 2026 All-Star Game (the All-Star Game break occurred from July 13 to 16), Toronto’s defence ranked sixth (+17 FRV). On the good news front, after the Midsummer Classic, the team has generated an additional 17 FRV, the second-highest total during the July 17 to August 15 period. What would an article be without tables? Behold a table concerning Toronto’s recent FRV scores and rankings. Not to be forgotten, gaze upon details of the 2026 Blue Jays’ pre- and post-All-Star Game non-pitcher defence. Season Toronto Blue Jays' Fielding Run Values Total Catcher Infield Outfield Up the Middle 2026 34 25 8 1 39 2025 45 32 3 10 47 2024 51 19 2 29 39 2023 15 11 -12 15 22 Season Toronto Blue Jays' Fielding Run Value Rankings Total Catcher Infield Outfield Up the Middle 2026 2 1 9 12 2 2025 1 1 12 6 1 2024 1 3 17 1 1 2023 7 6 23 2 8 Source: Baseball Savant. The current season’s numbers are as of August 15, 2026. Toronto Blue Jays' Fielding Run Values 2026 Non-Pitcher Innings Total Catcher Infield Outfield Up the Middle Season to Date 8,910 34 25 8 1 39 Before All-Star Game 6,800 17 19 3 -5 24 After All-Star Game 2,110 17 5 5 7 15 Toronto Blue Jays' Fielding Run Value Rankings 2026 Non-Pitcher Innings Total Catcher Infield Outfield Up the Middle Season to Date 8,910 2 1 9 12 2 Before All-Star Game 6,800 6 1 14 18 3 After All-Star Game 2,110 2 1 4 2 2 Source: Baseball Savant, as of August 15, 2026. So, why has Toronto’s defence improved after the All-Star Game? The first matter to highlight is the top-tier performance from Toronto’s catchers. Before the All-Star Game, the Blue Jays generated a +17 FRV, 19 of which was attributable to the catchers. In 850 innings, the Alejandro Kirk-Brandon Valenzuela-Tyler Heineman trio’s performance in the categories of Catcher Framing (+14 FRV), Catcher Throwing (+3 FRV) and Catcher Blocking (+2 FRV) was, in total, MLB’s best. After the All-Star Game, Kirk and Valenzuela have produced a +5 FRV mark in 263 innings, which is MLB’s best during the post-Midsummer Classic period. Toronto’s catchers continue to excel defensively. If the Blue Jays’ catchers posted a +19 FRV before the All-Star Game, and Toronto’s total FRV was +17, then Toronto’s infield and outfield posted a -2 FRV in 5,950 pre-Midsummer Classic innings. Furthermore, Toronto’s infield/outfield FRV ranked 16th. In 2025 and 2024, the Blue Jays’ infield/outfield slotted in at #7 (+13 FRV) and #1 (+32 FRV), respectively. Clearly, the team saw a pre-All-Star Game relative performance drop-off in 2026 compared to the previous two campaigns. In the infield, two positive contributors stood out before July 17: Giménez (+8 FRV) in 725 innings and Vladimir Guerrero Jr. (+3 FRV) in 694. The infielder with the worst FRV was Ernie Clement (-5 FRV), who has struggled at second base. Other infielders with negative FRVs were Kazuma Okamoto (-1), Lenyn Sosa (-1) and Davis Schneider (-1). However, the infield crew has improved after the All-Star Game. Notably, Toronto’s infielders recorded the same net +4 FRV after July 16 in 1,054 innings as they did before July 17 (but in 3,400 innings). Notably, Giménez has been terrific recently. In 500 fewer innings than he played before the All-Star Game break, Giménez has generated a +5 FRV afterwards. Also, post-All-Star Game, Clement has produced a +2 FRV, which is a positive development. On the negative side of the ledger, Okamoto has struggled defensively after the All-Star Game break (-3 FRV). Overall, a happy story: Toronto’s infield has posted the fourth-highest FRV after July 16, whereas they ranked 14th before July 17. Concerning the outfield, the Blue Jays’ defence was a disappointment before the All-Star Game. The group's net -3 FRV slotted in at #18, quite different from 2025’s #6 ranking, 2024’s #2 slot and 2023’s numero uno perch. On the plus side, Toronto had four outfielders each with a +2 FRV: Varsho, Nathan Lukes, Straw, and Addison Barger. Jonatan Clase chipped in with a +1 FRV. On the negative side, oh boy. Jesús Sánchez rolled with -7 FRV, and Yohendrick Piñango “contributed” a -4 FRV. Given the poor outfield defence of Sánchez and Piñango, a variation of an old Michael Jackson joke seems apropos. What do Michael Jackson, Jesús Sánchez, and Yohendrick Piñango have in common? Each wears one glove for no apparent reason. However, things have improved after July 12. The Sánchez-Piñango Show has had a short post-All-Star Game run. The duo has roamed the outfield for a combined 101 innings, which is fewer than the 802 innings of pre-July 17 terror. In those limited innings, the duo has produced a -1 FRV after July 12. Conversely, the other outfielders have stepped up to the plate, if you will, after the All-Star Game. Lukes has shone brightly (+4 FRV) in 238 fewer innings, and Straw slides in with another +2 FRV, but in 180 innings, fewer than his 354 innings before July 17. The newly minted Brett Bateman has produced a +1 FRV in just 76 innings. Hence, there are three reasons for Toronto’s improved outfield defence after the All-Star Game. First, Sánchez and Piñango are patrolling the outfield a lot less than they did before. Second, Lukes and Straw have excelled after July 12. Third, as advertised, Bateman plays center field very well. The Last Word In recent seasons, the Toronto Blue Jays have been one of MLB's best defensive teams. In 2025 and 2024, Toronto produced the highest FRV scores in each of those seasons. As of August 15, Toronto ranks second-best. However, before the All-Star Game, the Blue Jays were only MLB’s sixth-best defence, and that ranking was masked by the defensive prowess of Toronto’s catchers. The infield and outfield, as a unit, ranked 16th; the catchers were MLB’s best. Separately, the infield had the 14th-highest FRV, and the outfield recorded the 18th-highest. The main drags on performance were second baseman Clement and outfielders Sánchez and Piñango. After the All-Star Game break, Toronto’s defence has been MLB’s second-best. The catcher tandem of Kirk and Valenzuela continues to provide Toronto with the best catcher defence. Furthermore, the infield’s defence is MLB’s fourth-best post-All-Star break, and the outfield has produced the second-most FRV. Toronto’s prowess in the field is critical if the Blue Jays are to make the 2026 postseason. Fortunately, post-All-Star Game, Toronto’s top-tier defence has returned!
 -
During recent offseasons, the Toronto Blue Jays have made acquisitions that emphasized top-tier defence. For example, they added Daulton Varsho, Kevin Kiermaier, Matt Chapman, Andrés Giménez and Myles Straw. In terms of total Fielding Run Value (“FRV”), Toronto ranked seventh in 2023 and first in both 2024 and 2025. This season, because the Blue Jays’ offence is poor (27th in wRC+ and 28th in runs), superior defence is critical if Toronto is to capture a place in the postseason. To that end, as of August 15, 2026, the Blue Jays posted a +34 FRV total, the second-highest in MLB. However, before the 2026 All-Star Game (the All-Star Game break occurred from July 13 to 16), Toronto’s defence ranked sixth (+17 FRV). On the good news front, after the Midsummer Classic, the team has generated an additional 17 FRV, the second-highest total during the July 17 to August 15 period. What would an article be without tables? Behold a table concerning Toronto’s recent FRV scores and rankings. Not to be forgotten, gaze upon details of the 2026 Blue Jays’ pre- and post-All-Star Game non-pitcher defence. Season Toronto Blue Jays' Fielding Run Values Total Catcher Infield Outfield Up the Middle 2026 34 25 8 1 39 2025 45 32 3 10 47 2024 51 19 2 29 39 2023 15 11 -12 15 22 Season Toronto Blue Jays' Fielding Run Value Rankings Total Catcher Infield Outfield Up the Middle 2026 2 1 9 12 2 2025 1 1 12 6 1 2024 1 3 17 1 1 2023 7 6 23 2 8 Source: Baseball Savant. The current season’s numbers are as of August 15, 2026. Toronto Blue Jays' Fielding Run Values 2026 Non-Pitcher Innings Total Catcher Infield Outfield Up the Middle Season to Date 8,910 34 25 8 1 39 Before All-Star Game 6,800 17 19 3 -5 24 After All-Star Game 2,110 17 5 5 7 15 Toronto Blue Jays' Fielding Run Value Rankings 2026 Non-Pitcher Innings Total Catcher Infield Outfield Up the Middle Season to Date 8,910 2 1 9 12 2 Before All-Star Game 6,800 6 1 14 18 3 After All-Star Game 2,110 2 1 4 2 2 Source: Baseball Savant, as of August 15, 2026. So, why has Toronto’s defence improved after the All-Star Game? The first matter to highlight is the top-tier performance from Toronto’s catchers. Before the All-Star Game, the Blue Jays generated a +17 FRV, 19 of which was attributable to the catchers. In 850 innings, the Alejandro Kirk-Brandon Valenzuela-Tyler Heineman trio’s performance in the categories of Catcher Framing (+14 FRV), Catcher Throwing (+3 FRV) and Catcher Blocking (+2 FRV) was, in total, MLB’s best. After the All-Star Game, Kirk and Valenzuela have produced a +5 FRV mark in 263 innings, which is MLB’s best during the post-Midsummer Classic period. Toronto’s catchers continue to excel defensively. If the Blue Jays’ catchers posted a +19 FRV before the All-Star Game, and Toronto’s total FRV was +17, then Toronto’s infield and outfield posted a -2 FRV in 5,950 pre-Midsummer Classic innings. Furthermore, Toronto’s infield/outfield FRV ranked 16th. In 2025 and 2024, the Blue Jays’ infield/outfield slotted in at #7 (+13 FRV) and #1 (+32 FRV), respectively. Clearly, the team saw a pre-All-Star Game relative performance drop-off in 2026 compared to the previous two campaigns. In the infield, two positive contributors stood out before July 17: Giménez (+8 FRV) in 725 innings and Vladimir Guerrero Jr. (+3 FRV) in 694. The infielder with the worst FRV was Ernie Clement (-5 FRV), who has struggled at second base. Other infielders with negative FRVs were Kazuma Okamoto (-1), Lenyn Sosa (-1) and Davis Schneider (-1). However, the infield crew has improved after the All-Star Game. Notably, Toronto’s infielders recorded the same net +4 FRV after July 16 in 1,054 innings as they did before July 17 (but in 3,400 innings). Notably, Giménez has been terrific recently. In 500 fewer innings than he played before the All-Star Game break, Giménez has generated a +5 FRV afterwards. Also, post-All-Star Game, Clement has produced a +2 FRV, which is a positive development. On the negative side of the ledger, Okamoto has struggled defensively after the All-Star Game break (-3 FRV). Overall, a happy story: Toronto’s infield has posted the fourth-highest FRV after July 16, whereas they ranked 14th before July 17. Concerning the outfield, the Blue Jays’ defence was a disappointment before the All-Star Game. The group's net -3 FRV slotted in at #18, quite different from 2025’s #6 ranking, 2024’s #2 slot and 2023’s numero uno perch. On the plus side, Toronto had four outfielders each with a +2 FRV: Varsho, Nathan Lukes, Straw, and Addison Barger. Jonatan Clase chipped in with a +1 FRV. On the negative side, oh boy. Jesús Sánchez rolled with -7 FRV, and Yohendrick Piñango “contributed” a -4 FRV. Given the poor outfield defence of Sánchez and Piñango, a variation of an old Michael Jackson joke seems apropos. What do Michael Jackson, Jesús Sánchez, and Yohendrick Piñango have in common? Each wears one glove for no apparent reason. However, things have improved after July 12. The Sánchez-Piñango Show has had a short post-All-Star Game run. The duo has roamed the outfield for a combined 101 innings, which is fewer than the 802 innings of pre-July 17 terror. In those limited innings, the duo has produced a -1 FRV after July 12. Conversely, the other outfielders have stepped up to the plate, if you will, after the All-Star Game. Lukes has shone brightly (+4 FRV) in 238 fewer innings, and Straw slides in with another +2 FRV, but in 180 innings, fewer than his 354 innings before July 17. The newly minted Brett Bateman has produced a +1 FRV in just 76 innings. Hence, there are three reasons for Toronto’s improved outfield defence after the All-Star Game. First, Sánchez and Piñango are patrolling the outfield a lot less than they did before. Second, Lukes and Straw have excelled after July 12. Third, as advertised, Bateman plays center field very well. The Last Word In recent seasons, the Toronto Blue Jays have been one of MLB's best defensive teams. In 2025 and 2024, Toronto produced the highest FRV scores in each of those seasons. As of August 15, Toronto ranks second-best. However, before the All-Star Game, the Blue Jays were only MLB’s sixth-best defence, and that ranking was masked by the defensive prowess of Toronto’s catchers. The infield and outfield, as a unit, ranked 16th; the catchers were MLB’s best. Separately, the infield had the 14th-highest FRV, and the outfield recorded the 18th-highest. The main drags on performance were second baseman Clement and outfielders Sánchez and Piñango. After the All-Star Game break, Toronto’s defence has been MLB’s second-best. The catcher tandem of Kirk and Valenzuela continues to provide Toronto with the best catcher defence. Furthermore, the infield’s defence is MLB’s fourth-best post-All-Star break, and the outfield has produced the second-most FRV. Toronto’s prowess in the field is critical if the Blue Jays are to make the 2026 postseason. Fortunately, post-All-Star Game, Toronto’s top-tier defence has returned! View full article
-
Bob Ritchie reacted to an article:
Should the Blue Jays Re-Evaluate Their Offensive Identity?
-
Terry Mesmer reacted to an article:
Answer: W.C. Fields, Kevin Gausman and Jeff Hoffman
-
.jpg.74a90cbb8c89b6db013e411c86f2864f.jpg) W.C. Fields was an American actor, comedian, and writer. Among many things, he was famous for suggesting that his gravestone would read "Here Lies / W. C. Fields / I Would Rather Be Living in Philadelphia." With the MLB trade deadline approaching, could Kevin Gausman and Jeff Hoffman soon be living in Philadelphia? After the games of July 23, the Toronto Blue Jays have a 47-56 win-loss record and are six games out of a Wild Card spot. Currently, according to FanGraphs, Toronto has less than a 10 percent probability of making the 2026 postseason. One can presume that the Blue Jays will be sellers before the August 3 trade deadline. Philadelphia is in second place in the National League East division, four and a half games behind the Atlanta Braves. With 59 games remaining, the Phillies could catch the Braves and capture the division title. In terms of securing a playoff spot, FanGraphs lists Philadelphia’s chances at 84.3%. The Phillies are likely to be trade deadline buyers, and both Gausman and Hoffman may be of interest to Philadelphia. Concerning starting pitchers, the Phillies have a 10.9 fWAR, MLB’s fourth-highest. However, 10.2 of that fWAR total is attributed to three starters: Cristopher Sánchez (4.2), Jesús Luzardo (3.4) and Zack Wheeler (3.0). Aaron Nola, who is in the third year of a seven-year, $172 million contract, has generated a 0.6 fWAR. Currently, Philadelphia’s fifth starter is 28-year-old Alan Rangel, who has recorded a 0.1 fWAR in 23 innings, together with a 5.40 ERA, 4.12 xERA and a 4.91 FIP. Andrew Painter, Philadelphia’s highly-touted prospect, made his MLB debut this season. After he posted a 7.36 ERA, 5.59 xERA, and 5.87 FIP in 55 innings, the Phillies optioned Painter to the minors in mid-June. The Gausman-Philly fit is obvious, and given Philadelphia is not on Gausman’s no-trade list, doable. Although Gausman has struggled in his last six starts (6.14 xERA, 5.09 FIP and 35 Game Score), and his 2026 4.51 ERA, 4.01 xERA and 3.68 FIP exceed his Blue Jay numbers before this season, Gausman (2.2 fWAR) would be a solid addition for the Phillies. By comparison, Nola’s season-to-date numbers are worse: 5.82 ERA, 4.30 xERA and 5.06 FIP. In his last six starts, Nola recorded a 4.24 xERA, 6.04 FIP and 42 Game Score. Based upon 2026 numbers, Gausman would slide into the No. 4 starter slot, thereby moving Nola to No. 5 and Rangel out of the rotation. By adding Gausman, Philadelphia would strengthen its rotation, thereby improving its chances of overtaking Atlanta for the division title. Also, given that teams typically use four starters in the postseason, with the top three handling the bulk of the starts, the Gausman addition gives Philadelphia a valuable choice (Gausman or Nola) for the fourth spot in a postseason starting rotation. Concerning Hoffman, Philadelphia, like any contender, will add to its bullpen. Also, during the most recent offseason, the Phillies signed Brad Keller to a two-year, $22 million contract. However, on July 16, Philadelphia placed Keller on the 15-day injured list with a torn UCL. Surgery remains an option, and Keller is likely finished for the balance of the 2026 campaign. Hence, an opening for a Hoffman acquisition. No doubt some will question why Philadelphia would be interested in Hoffman. Hoffman is no longer Toronto’s closer, and he has had more than a few less-than-ideal outings. However, his overall numbers are particularly good. Regarding xERA, whiff rate, strikeout rate and hard-hit rate, his percentile rankings are 75th, 98th, 97th and 88th, respectively. Keller has corresponding percentile rankings of 75th, 29th, 57th and 89th, respectively. Furthermore, in terms of roles, 75% of Keller’s relief appearances occurred in the seventh and eighth innings, whereas 56% of Hoffman’s outings occurred during the same innings. Hoffman also has 14 ninth-inning appearances, eight more than Keller. In the seventh and eighth innings, Keller has a .263 xwOBA, a tad higher than Hoffman’s .255 (MLB Average xwOBA is 0.317). Notably, Hoffman found his reliever niche in Philadelphia as recently as 2024 and is therefore familiar with the team and city. Lastly, he is under contract for 2027, which makes him especially attractive to Philadelphia if Keller undergoes Tommy John surgery and misses most, if not all, of the 2027 season. He is an ideal candidate to be Keller’s replacement. There are two additional matters to address. First, both Toronto’s and Philadelphia’s payrolls for Competitive Balance Tax purposes exceed the highest threshold ($304 million). Cot’s Baseball Contracts projects Toronto’s 2026 CBT payroll to be $321.3 million and Philadelphia’s to be $317.0 million. Toronto, as a second-time payor, pays a 90% tax on any dollar that exceeds $304 million, whereas Philadelphia, as a third-time CBT payor, pays 110%. Assuming an August 3 Gausman-Hoffman trade to Philadelphia, and ignoring the players acquired by Toronto, Toronto would save $19.2 million: salary ($10.5 million) and CBT ($8.7 million). Philadelphia, because of its higher CBT rate, would incur an additional $21.2 million cash outlay: salary ($10.5 million) and CBT ($10.7 million). In Philadelphia’s case, the Gausman-Hoffman 2026 cash hit may or may not be an issue. On one hand, Philadelphia’s Dave Dombrowski is not reluctant to spend money on player payroll. On the other hand, $21.2 million is $21.2 million. The other matter worthy of note would be Toronto’s return for Gausman and Hoffman. Jays Centre’s Matthew Creally suggested an A-minus prospect and a deep sleeper, or two mid-range prospects, for Gausman alone. What could a Philadelphia package look like if Toronto sent both Gausman and Hoffman? A good place to start is Baseball Trade Values (“BTV”). For a description of how BTV values minor league prospects, refer to this outline and to this post concerning valuing major leaguers. A benefit of using BTV for analyzing trade packages is its third-party objectivity. So, what are the trade values of Gausman and Hoffman? Per BTV, Gausman has a trade value of $3.8 million, and Hoffman’s value is minus $6.8 million. In theory, a Gausman-Hoffman package is worth negative $3 million. However, in my opinion, their value is much higher for three reasons. First, Philadelphia is a motivated buyer, and second, relievers tend to have more value at the trade deadline than earlier in the season. The third and last reason for a higher value for the Gausman-Hoffman package is that Toronto is probably looking for a reset amid a disappointing 2026 campaign. Accordingly, they would like to retain Hoffman, who is under contract for next season. Hoffman may have disappointed as a closer, but he is a valuable reliever out of the bullpen and would be for the 2027 Blue Jays. Hence, Philadelphia would need to “overpay” for Hoffman in particular for Toronto to consider including Hoffman in a trade. What Philadelphia prospects would be fair value for Gausman and Hoffman? Well, probably at least a top-five prospect. In their November 10, 2025 report (subscription required), Jarrett Seidler and the Baseball Prospectus staff began the evaluation of the team's No. 6 prospect (Dante Nori) with the sentence, "And here’s exactly where the system goes off a cliff." Likewise, The Athletic’s Keith Law opined in his January 26, 2026, ranking of all farm systems (subscription required) that “the Phillies have three top-50 prospects, all three of whom could be stars (but only one of whom is really on that path right now), and another on the top 100, but there’s a big dropoff after that.” Since the Baseball Prospectus and Law’s articles were published, Aidan Miller (Law’s #1 Phillies prospect) suffered a back injury and has yet to play this season. Therefore, Toronto should insist upon either Gage Wood ($17.3 million BTV sticker price) or Justin Crawford ($18.5 million BTV price). According to Baseball America’s July 20, 2026, report and MLB Pipeline’s prospect rankings, Wood is Philadelphia’s No. 1 prospect. Crawford, son of former MLB player Carl Crawford, made his MLB debut this season and is on Philadelphia’s 26-man roster. He has posted a 78 wRC+ in 298 plate appearances with little power (.087 ISO). If Philadelphia balks at trading Crawford to Toronto because he is currently on the MLB roster, Toronto could send Daulton Varsho, who has a $3.4 million BTV price, along for the ride to Philadelphia! The Last Word If the Toronto Blue Jays become sellers at the trade deadline, they should trade their impending free agents, such as Gausman, and also consider trades including players under contract in 2027 (for example, Hoffman). The Philadelphia Phillies are widely known to be on the hunt for a starter and a set-up bullpen arm. Historically, teams have sent several mid-level prospects in exchange for either a Gausman-like or a Hoffman-like player. However, because it would be a Gausman-Hoffman package, and given Philadelphia’s top-heavy but not deep prospect pool, Toronto should require a top-five Philadelphia prospect/young player in exchange for Gausman and Hoffman. "Philadelphia, wonderful town, spent a week there one night." -W.C. Fields
W.C. Fields was an American actor, comedian, and writer. Among many things, he was famous for suggesting that his gravestone would read "Here Lies / W. C. Fields / I Would Rather Be Living in Philadelphia." With the MLB trade deadline approaching, could Kevin Gausman and Jeff Hoffman soon be living in Philadelphia? After the games of July 23, the Toronto Blue Jays have a 47-56 win-loss record and are six games out of a Wild Card spot. Currently, according to FanGraphs, Toronto has less than a 10 percent probability of making the 2026 postseason. One can presume that the Blue Jays will be sellers before the August 3 trade deadline. Philadelphia is in second place in the National League East division, four and a half games behind the Atlanta Braves. With 59 games remaining, the Phillies could catch the Braves and capture the division title. In terms of securing a playoff spot, FanGraphs lists Philadelphia’s chances at 84.3%. The Phillies are likely to be trade deadline buyers, and both Gausman and Hoffman may be of interest to Philadelphia. Concerning starting pitchers, the Phillies have a 10.9 fWAR, MLB’s fourth-highest. However, 10.2 of that fWAR total is attributed to three starters: Cristopher Sánchez (4.2), Jesús Luzardo (3.4) and Zack Wheeler (3.0). Aaron Nola, who is in the third year of a seven-year, $172 million contract, has generated a 0.6 fWAR. Currently, Philadelphia’s fifth starter is 28-year-old Alan Rangel, who has recorded a 0.1 fWAR in 23 innings, together with a 5.40 ERA, 4.12 xERA and a 4.91 FIP. Andrew Painter, Philadelphia’s highly-touted prospect, made his MLB debut this season. After he posted a 7.36 ERA, 5.59 xERA, and 5.87 FIP in 55 innings, the Phillies optioned Painter to the minors in mid-June. The Gausman-Philly fit is obvious, and given Philadelphia is not on Gausman’s no-trade list, doable. Although Gausman has struggled in his last six starts (6.14 xERA, 5.09 FIP and 35 Game Score), and his 2026 4.51 ERA, 4.01 xERA and 3.68 FIP exceed his Blue Jay numbers before this season, Gausman (2.2 fWAR) would be a solid addition for the Phillies. By comparison, Nola’s season-to-date numbers are worse: 5.82 ERA, 4.30 xERA and 5.06 FIP. In his last six starts, Nola recorded a 4.24 xERA, 6.04 FIP and 42 Game Score. Based upon 2026 numbers, Gausman would slide into the No. 4 starter slot, thereby moving Nola to No. 5 and Rangel out of the rotation. By adding Gausman, Philadelphia would strengthen its rotation, thereby improving its chances of overtaking Atlanta for the division title. Also, given that teams typically use four starters in the postseason, with the top three handling the bulk of the starts, the Gausman addition gives Philadelphia a valuable choice (Gausman or Nola) for the fourth spot in a postseason starting rotation. Concerning Hoffman, Philadelphia, like any contender, will add to its bullpen. Also, during the most recent offseason, the Phillies signed Brad Keller to a two-year, $22 million contract. However, on July 16, Philadelphia placed Keller on the 15-day injured list with a torn UCL. Surgery remains an option, and Keller is likely finished for the balance of the 2026 campaign. Hence, an opening for a Hoffman acquisition. No doubt some will question why Philadelphia would be interested in Hoffman. Hoffman is no longer Toronto’s closer, and he has had more than a few less-than-ideal outings. However, his overall numbers are particularly good. Regarding xERA, whiff rate, strikeout rate and hard-hit rate, his percentile rankings are 75th, 98th, 97th and 88th, respectively. Keller has corresponding percentile rankings of 75th, 29th, 57th and 89th, respectively. Furthermore, in terms of roles, 75% of Keller’s relief appearances occurred in the seventh and eighth innings, whereas 56% of Hoffman’s outings occurred during the same innings. Hoffman also has 14 ninth-inning appearances, eight more than Keller. In the seventh and eighth innings, Keller has a .263 xwOBA, a tad higher than Hoffman’s .255 (MLB Average xwOBA is 0.317). Notably, Hoffman found his reliever niche in Philadelphia as recently as 2024 and is therefore familiar with the team and city. Lastly, he is under contract for 2027, which makes him especially attractive to Philadelphia if Keller undergoes Tommy John surgery and misses most, if not all, of the 2027 season. He is an ideal candidate to be Keller’s replacement. There are two additional matters to address. First, both Toronto’s and Philadelphia’s payrolls for Competitive Balance Tax purposes exceed the highest threshold ($304 million). Cot’s Baseball Contracts projects Toronto’s 2026 CBT payroll to be $321.3 million and Philadelphia’s to be $317.0 million. Toronto, as a second-time payor, pays a 90% tax on any dollar that exceeds $304 million, whereas Philadelphia, as a third-time CBT payor, pays 110%. Assuming an August 3 Gausman-Hoffman trade to Philadelphia, and ignoring the players acquired by Toronto, Toronto would save $19.2 million: salary ($10.5 million) and CBT ($8.7 million). Philadelphia, because of its higher CBT rate, would incur an additional $21.2 million cash outlay: salary ($10.5 million) and CBT ($10.7 million). In Philadelphia’s case, the Gausman-Hoffman 2026 cash hit may or may not be an issue. On one hand, Philadelphia’s Dave Dombrowski is not reluctant to spend money on player payroll. On the other hand, $21.2 million is $21.2 million. The other matter worthy of note would be Toronto’s return for Gausman and Hoffman. Jays Centre’s Matthew Creally suggested an A-minus prospect and a deep sleeper, or two mid-range prospects, for Gausman alone. What could a Philadelphia package look like if Toronto sent both Gausman and Hoffman? A good place to start is Baseball Trade Values (“BTV”). For a description of how BTV values minor league prospects, refer to this outline and to this post concerning valuing major leaguers. A benefit of using BTV for analyzing trade packages is its third-party objectivity. So, what are the trade values of Gausman and Hoffman? Per BTV, Gausman has a trade value of $3.8 million, and Hoffman’s value is minus $6.8 million. In theory, a Gausman-Hoffman package is worth negative $3 million. However, in my opinion, their value is much higher for three reasons. First, Philadelphia is a motivated buyer, and second, relievers tend to have more value at the trade deadline than earlier in the season. The third and last reason for a higher value for the Gausman-Hoffman package is that Toronto is probably looking for a reset amid a disappointing 2026 campaign. Accordingly, they would like to retain Hoffman, who is under contract for next season. Hoffman may have disappointed as a closer, but he is a valuable reliever out of the bullpen and would be for the 2027 Blue Jays. Hence, Philadelphia would need to “overpay” for Hoffman in particular for Toronto to consider including Hoffman in a trade. What Philadelphia prospects would be fair value for Gausman and Hoffman? Well, probably at least a top-five prospect. In their November 10, 2025 report (subscription required), Jarrett Seidler and the Baseball Prospectus staff began the evaluation of the team's No. 6 prospect (Dante Nori) with the sentence, "And here’s exactly where the system goes off a cliff." Likewise, The Athletic’s Keith Law opined in his January 26, 2026, ranking of all farm systems (subscription required) that “the Phillies have three top-50 prospects, all three of whom could be stars (but only one of whom is really on that path right now), and another on the top 100, but there’s a big dropoff after that.” Since the Baseball Prospectus and Law’s articles were published, Aidan Miller (Law’s #1 Phillies prospect) suffered a back injury and has yet to play this season. Therefore, Toronto should insist upon either Gage Wood ($17.3 million BTV sticker price) or Justin Crawford ($18.5 million BTV price). According to Baseball America’s July 20, 2026, report and MLB Pipeline’s prospect rankings, Wood is Philadelphia’s No. 1 prospect. Crawford, son of former MLB player Carl Crawford, made his MLB debut this season and is on Philadelphia’s 26-man roster. He has posted a 78 wRC+ in 298 plate appearances with little power (.087 ISO). If Philadelphia balks at trading Crawford to Toronto because he is currently on the MLB roster, Toronto could send Daulton Varsho, who has a $3.4 million BTV price, along for the ride to Philadelphia! The Last Word If the Toronto Blue Jays become sellers at the trade deadline, they should trade their impending free agents, such as Gausman, and also consider trades including players under contract in 2027 (for example, Hoffman). The Philadelphia Phillies are widely known to be on the hunt for a starter and a set-up bullpen arm. Historically, teams have sent several mid-level prospects in exchange for either a Gausman-like or a Hoffman-like player. However, because it would be a Gausman-Hoffman package, and given Philadelphia’s top-heavy but not deep prospect pool, Toronto should require a top-five Philadelphia prospect/young player in exchange for Gausman and Hoffman. "Philadelphia, wonderful town, spent a week there one night." -W.C. Fields-
- 1
-
-
- kevin gausman
- jeff hoffman
- (and 1 more)
-
W.C. Fields was an American actor, comedian, and writer. Among many things, he was famous for suggesting that his gravestone would read "Here Lies / W. C. Fields / I Would Rather Be Living in Philadelphia." With the MLB trade deadline approaching, could Kevin Gausman and Jeff Hoffman soon be living in Philadelphia? After the games of July 23, the Toronto Blue Jays have a 47-56 win-loss record and are six games out of a Wild Card spot. Currently, according to FanGraphs, Toronto has less than a 10 percent probability of making the 2026 postseason. One can presume that the Blue Jays will be sellers before the August 3 trade deadline. Philadelphia is in second place in the National League East division, four and a half games behind the Atlanta Braves. With 59 games remaining, the Phillies could catch the Braves and capture the division title. In terms of securing a playoff spot, FanGraphs lists Philadelphia’s chances at 84.3%. The Phillies are likely to be trade deadline buyers, and both Gausman and Hoffman may be of interest to Philadelphia. Concerning starting pitchers, the Phillies have a 10.9 fWAR, MLB’s fourth-highest. However, 10.2 of that fWAR total is attributed to three starters: Cristopher Sánchez (4.2), Jesús Luzardo (3.4) and Zack Wheeler (3.0). Aaron Nola, who is in the third year of a seven-year, $172 million contract, has generated a 0.6 fWAR. Currently, Philadelphia’s fifth starter is 28-year-old Alan Rangel, who has recorded a 0.1 fWAR in 23 innings, together with a 5.40 ERA, 4.12 xERA and a 4.91 FIP. Andrew Painter, Philadelphia’s highly-touted prospect, made his MLB debut this season. After he posted a 7.36 ERA, 5.59 xERA, and 5.87 FIP in 55 innings, the Phillies optioned Painter to the minors in mid-June. The Gausman-Philly fit is obvious, and given Philadelphia is not on Gausman’s no-trade list, doable. Although Gausman has struggled in his last six starts (6.14 xERA, 5.09 FIP and 35 Game Score), and his 2026 4.51 ERA, 4.01 xERA and 3.68 FIP exceed his Blue Jay numbers before this season, Gausman (2.2 fWAR) would be a solid addition for the Phillies. By comparison, Nola’s season-to-date numbers are worse: 5.82 ERA, 4.30 xERA and 5.06 FIP. In his last six starts, Nola recorded a 4.24 xERA, 6.04 FIP and 42 Game Score. Based upon 2026 numbers, Gausman would slide into the No. 4 starter slot, thereby moving Nola to No. 5 and Rangel out of the rotation. By adding Gausman, Philadelphia would strengthen its rotation, thereby improving its chances of overtaking Atlanta for the division title. Also, given that teams typically use four starters in the postseason, with the top three handling the bulk of the starts, the Gausman addition gives Philadelphia a valuable choice (Gausman or Nola) for the fourth spot in a postseason starting rotation. Concerning Hoffman, Philadelphia, like any contender, will add to its bullpen. Also, during the most recent offseason, the Phillies signed Brad Keller to a two-year, $22 million contract. However, on July 16, Philadelphia placed Keller on the 15-day injured list with a torn UCL. Surgery remains an option, and Keller is likely finished for the balance of the 2026 campaign. Hence, an opening for a Hoffman acquisition. No doubt some will question why Philadelphia would be interested in Hoffman. Hoffman is no longer Toronto’s closer, and he has had more than a few less-than-ideal outings. However, his overall numbers are particularly good. Regarding xERA, whiff rate, strikeout rate and hard-hit rate, his percentile rankings are 75th, 98th, 97th and 88th, respectively. Keller has corresponding percentile rankings of 75th, 29th, 57th and 89th, respectively. Furthermore, in terms of roles, 75% of Keller’s relief appearances occurred in the seventh and eighth innings, whereas 56% of Hoffman’s outings occurred during the same innings. Hoffman also has 14 ninth-inning appearances, eight more than Keller. In the seventh and eighth innings, Keller has a .263 xwOBA, a tad higher than Hoffman’s .255 (MLB Average xwOBA is 0.317). Notably, Hoffman found his reliever niche in Philadelphia as recently as 2024 and is therefore familiar with the team and city. Lastly, he is under contract for 2027, which makes him especially attractive to Philadelphia if Keller undergoes Tommy John surgery and misses most, if not all, of the 2027 season. He is an ideal candidate to be Keller’s replacement. There are two additional matters to address. First, both Toronto’s and Philadelphia’s payrolls for Competitive Balance Tax purposes exceed the highest threshold ($304 million). Cot’s Baseball Contracts projects Toronto’s 2026 CBT payroll to be $321.3 million and Philadelphia’s to be $317.0 million. Toronto, as a second-time payor, pays a 90% tax on any dollar that exceeds $304 million, whereas Philadelphia, as a third-time CBT payor, pays 110%. Assuming an August 3 Gausman-Hoffman trade to Philadelphia, and ignoring the players acquired by Toronto, Toronto would save $19.2 million: salary ($10.5 million) and CBT ($8.7 million). Philadelphia, because of its higher CBT rate, would incur an additional $21.2 million cash outlay: salary ($10.5 million) and CBT ($10.7 million). In Philadelphia’s case, the Gausman-Hoffman 2026 cash hit may or may not be an issue. On one hand, Philadelphia’s Dave Dombrowski is not reluctant to spend money on player payroll. On the other hand, $21.2 million is $21.2 million. The other matter worthy of note would be Toronto’s return for Gausman and Hoffman. Jays Centre’s Matthew Creally suggested an A-minus prospect and a deep sleeper, or two mid-range prospects, for Gausman alone. What could a Philadelphia package look like if Toronto sent both Gausman and Hoffman? A good place to start is Baseball Trade Values (“BTV”). For a description of how BTV values minor league prospects, refer to this outline and to this post concerning valuing major leaguers. A benefit of using BTV for analyzing trade packages is its third-party objectivity. So, what are the trade values of Gausman and Hoffman? Per BTV, Gausman has a trade value of $3.8 million, and Hoffman’s value is minus $6.8 million. In theory, a Gausman-Hoffman package is worth negative $3 million. However, in my opinion, their value is much higher for three reasons. First, Philadelphia is a motivated buyer, and second, relievers tend to have more value at the trade deadline than earlier in the season. The third and last reason for a higher value for the Gausman-Hoffman package is that Toronto is probably looking for a reset amid a disappointing 2026 campaign. Accordingly, they would like to retain Hoffman, who is under contract for next season. Hoffman may have disappointed as a closer, but he is a valuable reliever out of the bullpen and would be for the 2027 Blue Jays. Hence, Philadelphia would need to “overpay” for Hoffman in particular for Toronto to consider including Hoffman in a trade. What Philadelphia prospects would be fair value for Gausman and Hoffman? Well, probably at least a top-five prospect. In their November 10, 2025 report (subscription required), Jarrett Seidler and the Baseball Prospectus staff began the evaluation of the team's No. 6 prospect (Dante Nori) with the sentence, "And here’s exactly where the system goes off a cliff." Likewise, The Athletic’s Keith Law opined in his January 26, 2026, ranking of all farm systems (subscription required) that “the Phillies have three top-50 prospects, all three of whom could be stars (but only one of whom is really on that path right now), and another on the top 100, but there’s a big dropoff after that.” Since the Baseball Prospectus and Law’s articles were published, Aidan Miller (Law’s #1 Phillies prospect) suffered a back injury and has yet to play this season. Therefore, Toronto should insist upon either Gage Wood ($17.3 million BTV sticker price) or Justin Crawford ($18.5 million BTV price). According to Baseball America’s July 20, 2026, report and MLB Pipeline’s prospect rankings, Wood is Philadelphia’s No. 1 prospect. Crawford, son of former MLB player Carl Crawford, made his MLB debut this season and is on Philadelphia’s 26-man roster. He has posted a 78 wRC+ in 298 plate appearances with little power (.087 ISO). If Philadelphia balks at trading Crawford to Toronto because he is currently on the MLB roster, Toronto could send Daulton Varsho, who has a $3.4 million BTV price, along for the ride to Philadelphia! The Last Word If the Toronto Blue Jays become sellers at the trade deadline, they should trade their impending free agents, such as Gausman, and also consider trades including players under contract in 2027 (for example, Hoffman). The Philadelphia Phillies are widely known to be on the hunt for a starter and a set-up bullpen arm. Historically, teams have sent several mid-level prospects in exchange for either a Gausman-like or a Hoffman-like player. However, because it would be a Gausman-Hoffman package, and given Philadelphia’s top-heavy but not deep prospect pool, Toronto should require a top-five Philadelphia prospect/young player in exchange for Gausman and Hoffman. "Philadelphia, wonderful town, spent a week there one night." -W.C. Fields View full article
-
Terry Mesmer reacted to an article:
Trey Yesavage Is the Lou Reed of the Toronto Blue Jays
-
The Toronto Blue Jays selected Trey Yesavage with the 20th pick in the 2024 MLB Amateur Draft. It is unusual for a player to advance through four MiLB levels in one season, let alone make his MLB debut that same year. But Yesavage did just that. He made his professional debut in 2025 with Dunedin and continued his journey through Vancouver, New Hampshire, and Buffalo. Overall, his MiLB numbers included a 3.12 ERA and a 1.90 xERA (at High-A and Triple-A). Then, Yesavage made his MLB debut on September 15. In three regular season games, he posted a 3.21 ERA, 4.09 xERA and a 2.35 FIP. In five postseason starts, he recorded a 3.58 ERA and a 3.61 FIP. Please note that unless otherwise stated, references to 2025 include the regular season and postseason. I included the postseason to bump up Yesavage’s innings from 14 to 42. Thus far in 2026, Yesavage has performed well overall. Among starters with at least 40 innings, his 3.72 ERA ranks in the 62nd percentile. Even better, his 3.31 xERA ranks in the 77th percentile among all pitchers, and his 5.5% barrel rate, a measure of soft contact, ranks in the 81st percentile. Another example of the soft contact that Yesavage has induced this season is his .296 xwOBAcon, which is xwOBA on batted balls. Among the 239 pitchers with at least 40 innings pitched, Yesavage’s xwOBAcon ranks as the seventh-lowest, though not quite as good as Tyler Rogers’ second-best ranking (.270). On the negative side of the ledger, Yesavage’s 22.2 K% and 12.5 BB% rank at the 47th and 12th percentiles, respectively. Last season, Yesavage posted a 32.2 K%, well above the 22.3% MLB average. I will address the K% decline later in the article. Concerning 2026 BB%, Yesavage has indeed taken a walk on the wild side. However, in his 2025 outings, Yesavage posted a 10.5 BB%, higher than the 2025 MLB average of 8.4%. Yes, Yesavage’s walk rate has risen in 2026, but he also had an elevated walk rate in 2025. The good news is that, as John Schneider and Yesavage opined, the lack of control is primarily due to posture. MLB.com’s Keegan Matheson has the details. If Yesavage can correct his pitch-mechanics issues, his walk rate should decline, which could lead to better overall numbers. Concerning FIP, his 4.11 ranks in the 48th percentile among starters with at least 40 innings. Yesavage’s FIP has suffered because of the low rankings of his K% and BB%, but is aided by his 81st percentile 0.84 HR/9. An issue of interest is Yesavage’s pitch mix and how opposing batters have fared against it. Behold the first table! The key observations are as follows: Yesavage has reduced his slider usage by almost eight percentage points, offset mainly by increasing the rate of four-seam fastballs. Consider xwOBA, which eliminates the impact of defence on the results and, accordingly, is a better measure of a pitcher’s effectiveness than wOBA. All his 2026 offerings generate xwOBA numbers better than the MLB average (all pitches). Furthermore, compared to 2025, the 2026 xwOBA results of the four-seam fastball and slider are better. Although the 2026 splitter is not as effective as last season, it remains Yesavage’s best pitch. It is noteworthy that the average velocities and spin rates of Yesavage’s three pitches are not materially different this season compared to last. All Four-Seam Fastball Slider Splitter Pitches % wOBA xwOBA % wOBA xwOBA % wOBA xwOBA % wOBA xwOBA 2026 (1) 1237 100.0 0.280 0.284 45.8 0.309 0.307 24.7 0.318 0.270 29.5 0.189 0.250 2025 (2) 679 100.0 0.270 0.285 40.1 0.356 0.372 32.5 0.256 0.299 27.4 0.202 0.188 MLB (1) 0.317 0.318 (1) Through July 12. (2) Includes postseason. Source: Baseball Savant Two other issues to consider are Yesavage’s ability to find the strike zone and batter whiff rates. The table below provides more details. Concerning throwing in-zone pitches, the notable change is the splitter. In 2025, Yesavage’s in-zone rate was 43%, much higher than 2026’s 30%. In terms of whiffs, this season, the rate on his splitter is 40%. That rate is five percentage points higher than MLB's 35% average for splitters but noticeably lower than his 58% in 2025. Given the splitter’s reduced in-zone rate this season, it appears that batters are more disciplined and, therefore, chasing less (30% chase rate in 2026, less than 2025’s 39%) and swinging at more in-zone splitters (60% swing rate in 2025 and 71% in 2026). Regarding whiff rate, the significant change is the in-zone whiff rate drop this season compared to last year (50% to 18%). However, there is a bright side to the splitter story. Despite higher in-zone and out-of-zone contact rates in 2026, the corresponding xISO scores are better or largely the same this season. On in-zone batted balls, the 2026 .144 xISO is lower than 2025’s .218 (the MLB in-zone splitter average xISO is .165). Concerning out-of-zone splitters, the 2026 xISO number is like last season (.013 versus .009). Therefore, compared to 2025, the batters in 2026 are chasing Yesavage’s splitter at a lower rate and making more contact, but it is pitcher-friendly contact (lower exit velocity and launch angle). In-Zone% Whiff% Splitter All 4-Seam Slider Splitter 4-Seam Slider Splitter Swing% Contact% Whiff% In Zone O-Zone In Zone O-Zone In Zone O-Zone 2026 (1) 43% 51% 44% 30% 19% 37% 40% 71% 30% 82% 38% 18% 62% 2025 (2) 47% 49% 48% 43% 20% 40% 58% 60% 39% 50% 32% 50% 68% MLB (1) 48% 53% 44% 36% 22% 33% 35% 78% 36% 79% 49% 21% 51% (1) Through July 12. (2) Includes postseason. Source: Baseball Savant Regarding the reduced K%, the causes are as follows: In 2025, 59.6% of all his plate appearances reached two strikes, which is higher than 2026’s 53.1%. Last season, the K% on his splitter was 56.1%, considerably higher than 2026’s 30.5%. Consistent with the noted higher contact rates on the splitter, the in-zone whiff rate with two strikes is 12.1% this season, which lags the 46.2% number in 2025. With two strikes, his out-of-zone whiff rate was 64.3%, higher than this season’s 48.7%. The increased 2026 K% on four-seam fastballs (17.1% versus 2025’s 12.7%) is partially offset by the lower K% on sliders in 2026 (23.9% versus 27.6%). In summary, the primary reason for Yesavage’s K% decline in 2026 is the splitter. With two strikes, batters are making contact at a higher rate this season than they did in 2025. A final matter to address is Yesavage’s consistency. Many people on social media have opined that Yesavage has been inconsistent this season, but that observation appears to be a case of recency bias. Consider Game Score. In 10 of his 14 starts, Yesavage has posted above-average Game Scores. Yes, his last outing was bad per the Game Score rule-of-thumb chart: a 22 Game Score in less than two innings, with seven walks and four earned runs. However, in his four previous starts, one was above average (57) and three were good (60 or higher). By comparison, Dylan Cease and Cristopher Sánchez, the two starters in the 2026 MLB All-Star Game, have posted below-average Game Scores at rates like Yesavage’s 28.6% rate (4/14). Notably, Cease’s below-average Game Score rate is 29.4% (5/17) and Sánchez’s is 25.0% (5/20). Obviously, by many metrics, both Cease and Sánchez have posted better 2026 numbers than Yesavage, including overall Game Scores of 63 and 61, respectively. However, contrary to the sentiment of many, Yesavage has been relatively consistent in 2026. The Last Word Yesavage burst onto the MLB scene last September. The combination of his elevated strikeout and swing-and-miss rates, together with his postseason success, made him an important member of Toronto’s starting rotation and a fan favourite. His performance this season has been good and more consistent than some people believe. Yesavage has generated an xERA that ranks in the 77th percentile among all pitchers. However, his strikeout and whiff rates have declined from 2025’s lofty heights, primarily due to batters in 2026 chasing the splitter less and making contact at a higher rate. Of note is his higher-than-average walk rate this season and last. It is reasonable for some MLB observers to wonder if Yesavage is the real-life Ricky Vaughn. Perhaps, under the direction of pitching coach Pete Walker and the boys in the lab, a change in posture can resolve Yesavage’s lack of control just as glasses did for Vaughn! View full article
-
.jpg.dd96dd3ab511053738391feb0d6060a3.jpg) The Toronto Blue Jays selected Trey Yesavage with the 20th pick in the 2024 MLB Amateur Draft. It is unusual for a player to advance through four MiLB levels in one season, let alone make his MLB debut that same year. But Yesavage did just that. He made his professional debut in 2025 with Dunedin and continued his journey through Vancouver, New Hampshire, and Buffalo. Overall, his MiLB numbers included a 3.12 ERA and a 1.90 xERA (at High-A and Triple-A). Then, Yesavage made his MLB debut on September 15. In three regular season games, he posted a 3.21 ERA, 4.09 xERA and a 2.35 FIP. In five postseason starts, he recorded a 3.58 ERA and a 3.61 FIP. Please note that unless otherwise stated, references to 2025 include the regular season and postseason. I included the postseason to bump up Yesavage’s innings from 14 to 42. Thus far in 2026, Yesavage has performed well overall. Among starters with at least 40 innings, his 3.72 ERA ranks in the 62nd percentile. Even better, his 3.31 xERA ranks in the 77th percentile among all pitchers, and his 5.5% barrel rate, a measure of soft contact, ranks in the 81st percentile. Another example of the soft contact that Yesavage has induced this season is his .296 xwOBAcon, which is xwOBA on batted balls. Among the 239 pitchers with at least 40 innings pitched, Yesavage’s xwOBAcon ranks as the seventh-lowest, though not quite as good as Tyler Rogers’ second-best ranking (.270). On the negative side of the ledger, Yesavage’s 22.2 K% and 12.5 BB% rank at the 47th and 12th percentiles, respectively. Last season, Yesavage posted a 32.2 K%, well above the 22.3% MLB average. I will address the K% decline later in the article. Concerning 2026 BB%, Yesavage has indeed taken a walk on the wild side. However, in his 2025 outings, Yesavage posted a 10.5 BB%, higher than the 2025 MLB average of 8.4%. Yes, Yesavage’s walk rate has risen in 2026, but he also had an elevated walk rate in 2025. The good news is that, as John Schneider and Yesavage opined, the lack of control is primarily due to posture. MLB.com’s Keegan Matheson has the details. If Yesavage can correct his pitch-mechanics issues, his walk rate should decline, which could lead to better overall numbers. Concerning FIP, his 4.11 ranks in the 48th percentile among starters with at least 40 innings. Yesavage’s FIP has suffered because of the low rankings of his K% and BB%, but is aided by his 81st percentile 0.84 HR/9. An issue of interest is Yesavage’s pitch mix and how opposing batters have fared against it. Behold the first table! The key observations are as follows: Yesavage has reduced his slider usage by almost eight percentage points, offset mainly by increasing the rate of four-seam fastballs. Consider xwOBA, which eliminates the impact of defence on the results and, accordingly, is a better measure of a pitcher’s effectiveness than wOBA. All his 2026 offerings generate xwOBA numbers better than the MLB average (all pitches). Furthermore, compared to 2025, the 2026 xwOBA results of the four-seam fastball and slider are better. Although the 2026 splitter is not as effective as last season, it remains Yesavage’s best pitch. It is noteworthy that the average velocities and spin rates of Yesavage’s three pitches are not materially different this season compared to last. All Four-Seam Fastball Slider Splitter Pitches % wOBA xwOBA % wOBA xwOBA % wOBA xwOBA % wOBA xwOBA 2026 (1) 1237 100.0 0.280 0.284 45.8 0.309 0.307 24.7 0.318 0.270 29.5 0.189 0.250 2025 (2) 679 100.0 0.270 0.285 40.1 0.356 0.372 32.5 0.256 0.299 27.4 0.202 0.188 MLB (1) 0.317 0.318 (1) Through July 12. (2) Includes postseason. Source: Baseball Savant Two other issues to consider are Yesavage’s ability to find the strike zone and batter whiff rates. The table below provides more details. Concerning throwing in-zone pitches, the notable change is the splitter. In 2025, Yesavage’s in-zone rate was 43%, much higher than 2026’s 30%. In terms of whiffs, this season, the rate on his splitter is 40%. That rate is five percentage points higher than MLB's 35% average for splitters but noticeably lower than his 58% in 2025. Given the splitter’s reduced in-zone rate this season, it appears that batters are more disciplined and, therefore, chasing less (30% chase rate in 2026, less than 2025’s 39%) and swinging at more in-zone splitters (60% swing rate in 2025 and 71% in 2026). Regarding whiff rate, the significant change is the in-zone whiff rate drop this season compared to last year (50% to 18%). However, there is a bright side to the splitter story. Despite higher in-zone and out-of-zone contact rates in 2026, the corresponding xISO scores are better or largely the same this season. On in-zone batted balls, the 2026 .144 xISO is lower than 2025’s .218 (the MLB in-zone splitter average xISO is .165). Concerning out-of-zone splitters, the 2026 xISO number is like last season (.013 versus .009). Therefore, compared to 2025, the batters in 2026 are chasing Yesavage’s splitter at a lower rate and making more contact, but it is pitcher-friendly contact (lower exit velocity and launch angle). In-Zone% Whiff% Splitter All 4-Seam Slider Splitter 4-Seam Slider Splitter Swing% Contact% Whiff% In Zone O-Zone In Zone O-Zone In Zone O-Zone 2026 (1) 43% 51% 44% 30% 19% 37% 40% 71% 30% 82% 38% 18% 62% 2025 (2) 47% 49% 48% 43% 20% 40% 58% 60% 39% 50% 32% 50% 68% MLB (1) 48% 53% 44% 36% 22% 33% 35% 78% 36% 79% 49% 21% 51% (1) Through July 12. (2) Includes postseason. Source: Baseball Savant Regarding the reduced K%, the causes are as follows: In 2025, 59.6% of all his plate appearances reached two strikes, which is higher than 2026’s 53.1%. Last season, the K% on his splitter was 56.1%, considerably higher than 2026’s 30.5%. Consistent with the noted higher contact rates on the splitter, the in-zone whiff rate with two strikes is 12.1% this season, which lags the 46.2% number in 2025. With two strikes, his out-of-zone whiff rate was 64.3%, higher than this season’s 48.7%. The increased 2026 K% on four-seam fastballs (17.1% versus 2025’s 12.7%) is partially offset by the lower K% on sliders in 2026 (23.9% versus 27.6%). In summary, the primary reason for Yesavage’s K% decline in 2026 is the splitter. With two strikes, batters are making contact at a higher rate this season than they did in 2025. A final matter to address is Yesavage’s consistency. Many people on social media have opined that Yesavage has been inconsistent this season, but that observation appears to be a case of recency bias. Consider Game Score. In 10 of his 14 starts, Yesavage has posted above-average Game Scores. Yes, his last outing was bad per the Game Score rule-of-thumb chart: a 22 Game Score in less than two innings, with seven walks and four earned runs. However, in his four previous starts, one was above average (57) and three were good (60 or higher). By comparison, Dylan Cease and Cristopher Sánchez, the two starters in the 2026 MLB All-Star Game, have posted below-average Game Scores at rates like Yesavage’s 28.6% rate (4/14). Notably, Cease’s below-average Game Score rate is 29.4% (5/17) and Sánchez’s is 25.0% (5/20). Obviously, by many metrics, both Cease and Sánchez have posted better 2026 numbers than Yesavage, including overall Game Scores of 63 and 61, respectively. However, contrary to the sentiment of many, Yesavage has been relatively consistent in 2026. The Last Word Yesavage burst onto the MLB scene last September. The combination of his elevated strikeout and swing-and-miss rates, together with his postseason success, made him an important member of Toronto’s starting rotation and a fan favourite. His performance this season has been good and more consistent than some people believe. Yesavage has generated an xERA that ranks in the 77th percentile among all pitchers. However, his strikeout and whiff rates have declined from 2025’s lofty heights, primarily due to batters in 2026 chasing the splitter less and making contact at a higher rate. Of note is his higher-than-average walk rate this season and last. It is reasonable for some MLB observers to wonder if Yesavage is the real-life Ricky Vaughn. Perhaps, under the direction of pitching coach Pete Walker and the boys in the lab, a change in posture can resolve Yesavage’s lack of control just as glasses did for Vaughn!
The Toronto Blue Jays selected Trey Yesavage with the 20th pick in the 2024 MLB Amateur Draft. It is unusual for a player to advance through four MiLB levels in one season, let alone make his MLB debut that same year. But Yesavage did just that. He made his professional debut in 2025 with Dunedin and continued his journey through Vancouver, New Hampshire, and Buffalo. Overall, his MiLB numbers included a 3.12 ERA and a 1.90 xERA (at High-A and Triple-A). Then, Yesavage made his MLB debut on September 15. In three regular season games, he posted a 3.21 ERA, 4.09 xERA and a 2.35 FIP. In five postseason starts, he recorded a 3.58 ERA and a 3.61 FIP. Please note that unless otherwise stated, references to 2025 include the regular season and postseason. I included the postseason to bump up Yesavage’s innings from 14 to 42. Thus far in 2026, Yesavage has performed well overall. Among starters with at least 40 innings, his 3.72 ERA ranks in the 62nd percentile. Even better, his 3.31 xERA ranks in the 77th percentile among all pitchers, and his 5.5% barrel rate, a measure of soft contact, ranks in the 81st percentile. Another example of the soft contact that Yesavage has induced this season is his .296 xwOBAcon, which is xwOBA on batted balls. Among the 239 pitchers with at least 40 innings pitched, Yesavage’s xwOBAcon ranks as the seventh-lowest, though not quite as good as Tyler Rogers’ second-best ranking (.270). On the negative side of the ledger, Yesavage’s 22.2 K% and 12.5 BB% rank at the 47th and 12th percentiles, respectively. Last season, Yesavage posted a 32.2 K%, well above the 22.3% MLB average. I will address the K% decline later in the article. Concerning 2026 BB%, Yesavage has indeed taken a walk on the wild side. However, in his 2025 outings, Yesavage posted a 10.5 BB%, higher than the 2025 MLB average of 8.4%. Yes, Yesavage’s walk rate has risen in 2026, but he also had an elevated walk rate in 2025. The good news is that, as John Schneider and Yesavage opined, the lack of control is primarily due to posture. MLB.com’s Keegan Matheson has the details. If Yesavage can correct his pitch-mechanics issues, his walk rate should decline, which could lead to better overall numbers. Concerning FIP, his 4.11 ranks in the 48th percentile among starters with at least 40 innings. Yesavage’s FIP has suffered because of the low rankings of his K% and BB%, but is aided by his 81st percentile 0.84 HR/9. An issue of interest is Yesavage’s pitch mix and how opposing batters have fared against it. Behold the first table! The key observations are as follows: Yesavage has reduced his slider usage by almost eight percentage points, offset mainly by increasing the rate of four-seam fastballs. Consider xwOBA, which eliminates the impact of defence on the results and, accordingly, is a better measure of a pitcher’s effectiveness than wOBA. All his 2026 offerings generate xwOBA numbers better than the MLB average (all pitches). Furthermore, compared to 2025, the 2026 xwOBA results of the four-seam fastball and slider are better. Although the 2026 splitter is not as effective as last season, it remains Yesavage’s best pitch. It is noteworthy that the average velocities and spin rates of Yesavage’s three pitches are not materially different this season compared to last. All Four-Seam Fastball Slider Splitter Pitches % wOBA xwOBA % wOBA xwOBA % wOBA xwOBA % wOBA xwOBA 2026 (1) 1237 100.0 0.280 0.284 45.8 0.309 0.307 24.7 0.318 0.270 29.5 0.189 0.250 2025 (2) 679 100.0 0.270 0.285 40.1 0.356 0.372 32.5 0.256 0.299 27.4 0.202 0.188 MLB (1) 0.317 0.318 (1) Through July 12. (2) Includes postseason. Source: Baseball Savant Two other issues to consider are Yesavage’s ability to find the strike zone and batter whiff rates. The table below provides more details. Concerning throwing in-zone pitches, the notable change is the splitter. In 2025, Yesavage’s in-zone rate was 43%, much higher than 2026’s 30%. In terms of whiffs, this season, the rate on his splitter is 40%. That rate is five percentage points higher than MLB's 35% average for splitters but noticeably lower than his 58% in 2025. Given the splitter’s reduced in-zone rate this season, it appears that batters are more disciplined and, therefore, chasing less (30% chase rate in 2026, less than 2025’s 39%) and swinging at more in-zone splitters (60% swing rate in 2025 and 71% in 2026). Regarding whiff rate, the significant change is the in-zone whiff rate drop this season compared to last year (50% to 18%). However, there is a bright side to the splitter story. Despite higher in-zone and out-of-zone contact rates in 2026, the corresponding xISO scores are better or largely the same this season. On in-zone batted balls, the 2026 .144 xISO is lower than 2025’s .218 (the MLB in-zone splitter average xISO is .165). Concerning out-of-zone splitters, the 2026 xISO number is like last season (.013 versus .009). Therefore, compared to 2025, the batters in 2026 are chasing Yesavage’s splitter at a lower rate and making more contact, but it is pitcher-friendly contact (lower exit velocity and launch angle). In-Zone% Whiff% Splitter All 4-Seam Slider Splitter 4-Seam Slider Splitter Swing% Contact% Whiff% In Zone O-Zone In Zone O-Zone In Zone O-Zone 2026 (1) 43% 51% 44% 30% 19% 37% 40% 71% 30% 82% 38% 18% 62% 2025 (2) 47% 49% 48% 43% 20% 40% 58% 60% 39% 50% 32% 50% 68% MLB (1) 48% 53% 44% 36% 22% 33% 35% 78% 36% 79% 49% 21% 51% (1) Through July 12. (2) Includes postseason. Source: Baseball Savant Regarding the reduced K%, the causes are as follows: In 2025, 59.6% of all his plate appearances reached two strikes, which is higher than 2026’s 53.1%. Last season, the K% on his splitter was 56.1%, considerably higher than 2026’s 30.5%. Consistent with the noted higher contact rates on the splitter, the in-zone whiff rate with two strikes is 12.1% this season, which lags the 46.2% number in 2025. With two strikes, his out-of-zone whiff rate was 64.3%, higher than this season’s 48.7%. The increased 2026 K% on four-seam fastballs (17.1% versus 2025’s 12.7%) is partially offset by the lower K% on sliders in 2026 (23.9% versus 27.6%). In summary, the primary reason for Yesavage’s K% decline in 2026 is the splitter. With two strikes, batters are making contact at a higher rate this season than they did in 2025. A final matter to address is Yesavage’s consistency. Many people on social media have opined that Yesavage has been inconsistent this season, but that observation appears to be a case of recency bias. Consider Game Score. In 10 of his 14 starts, Yesavage has posted above-average Game Scores. Yes, his last outing was bad per the Game Score rule-of-thumb chart: a 22 Game Score in less than two innings, with seven walks and four earned runs. However, in his four previous starts, one was above average (57) and three were good (60 or higher). By comparison, Dylan Cease and Cristopher Sánchez, the two starters in the 2026 MLB All-Star Game, have posted below-average Game Scores at rates like Yesavage’s 28.6% rate (4/14). Notably, Cease’s below-average Game Score rate is 29.4% (5/17) and Sánchez’s is 25.0% (5/20). Obviously, by many metrics, both Cease and Sánchez have posted better 2026 numbers than Yesavage, including overall Game Scores of 63 and 61, respectively. However, contrary to the sentiment of many, Yesavage has been relatively consistent in 2026. The Last Word Yesavage burst onto the MLB scene last September. The combination of his elevated strikeout and swing-and-miss rates, together with his postseason success, made him an important member of Toronto’s starting rotation and a fan favourite. His performance this season has been good and more consistent than some people believe. Yesavage has generated an xERA that ranks in the 77th percentile among all pitchers. However, his strikeout and whiff rates have declined from 2025’s lofty heights, primarily due to batters in 2026 chasing the splitter less and making contact at a higher rate. Of note is his higher-than-average walk rate this season and last. It is reasonable for some MLB observers to wonder if Yesavage is the real-life Ricky Vaughn. Perhaps, under the direction of pitching coach Pete Walker and the boys in the lab, a change in posture can resolve Yesavage’s lack of control just as glasses did for Vaughn! -
Bob Ritchie reacted to an article:
What Can We Learn About the Blue Jays From Statcast’s Newest Bat Tracking Metrics?
-
On July 27, 2024, the Blue Jays acquired Yohendrick Piñango and Josh Rivera from the Cubs in exchange for Nate Pearson. Last season, Piñango posted a 124 wRC+ with the Buffalo Bisons. However, Toronto left him off the 40-man roster before the Rule 5 draft. Fortunately for the Blue Jays, another team did not select him. Let us take a deeper dive into Piñango’s numbers. Since Piñango made his MLB debut on April 26, he has been one of the Blue Jays’ better hitters. As of May 25, his .342 OBP ranked second on the team, and his .333 wOBA and .403 SLG were the team's fourth-highest. In the field, many scouts considered his defence to be below average. Entering the May 25 game, Piñango had a 1 OAA and 0 FRV in limited innings (144). However, that evening, he misplayed two very makeable catches, which are not reflected in those OAA and FRV numbers. Also, he is not fleet of foot (44th percentile in sprint speed). For a more fulsome prospect report, please refer to the Jays Centre’s top prospect rankings. From a batted ball perspective, he is a straightaway hitter. Piñango’s pull rate is 32.7%, lower than the 37.4% MLB average. His straightaway contact rate is 43.6%, higher than the MLB average of 37.3%. Regarding opposite field rate, the MLB average is 25.1%, higher than Piñango’s 23.6% mark. He is also a contact hitter, as shown by his 83.7% contact rate (74.7% MLB average) and swings at pitches out of the zone at a 32.0% clip, slightly higher than MLB’s 30.1% average chase rate. Piñango’s strikeout, walk, and whiff rate marks are 17.1%, 5.3% and 19.9%, respectively. Those scores are lower than the corresponding MLB averages (22.1%, 9.3%, and 25.3%). Generating power is an area where Piñango lags the average MLB hitter: his .097 ISO and .099 xISO trail MLB’s average .148 ISO and .155 xISO. There are three reasons why Piñango has produced below-average power numbers. First, his pull rate lags the MLB average. On batted balls pulled, hit straightaway and to the opposite field, the MLB average ISO numbers are .312, .112 and .139, respectively. Piñango’s opportunity to generate ISO is limited due to his below-average amount of pulled contact. The second reason is launch angle. The MLB average launch angle is 13 degrees, whereas Piñango’s is 7 degrees. Consider that, on batted balls with a launch angle between 0 and 10 degrees, the average ISO and xISO are .065 and .071, respectively. Contrast those figures with launch angles between 11 and 15 degrees, on which the average ISO and xISO are .182 and .192, respectively. If Piñango could raise his average launch angle, we should observe higher ISO numbers. The third factor that negatively impacts Piñango’s power numbers is his attack angle/timing. According to the MLB website, attack angle is “in large part a timing metric, as the hitter’s attack angle is constantly changing throughout the course of the swing … When the hitter is behind the pitch with his swing (i.e., too late), he will tend to have a lower attack angle.” The MLB average attack angle is 9 degrees, but Piñango’s is -1 degree. Regarding ideal attack angle rate, his 21.9% is well below the MLB average of 48.8%. For context, the average ISO on batted balls with an attack angle between 5 and 20 degrees is .203. Concerning Piñango’s average attack angle, the MLB average ISO on batted balls with an attack angle between -1 and 4 degrees is .081. Notably, an issue for Piñango is not bat speed, as his average is 73.7 mph, faster than the MLB average of 69.8 mph. Therefore, as he gains MLB experience, if Piñango can generate a higher pull rate, launch angle and attack angle, he should post better power numbers. Now, to the question of whether Piñango should be Buffalo-bound when Barger returns, let us peek at a long-overdue table! SLG wOBA ISO OBP # Rank # Rank # Rank # Rank Lukes 0.357 10 0.309 8 0.071 13 0.328 5 Piñango 0.403 4 0.333 4 0.097 9 0.342 2 Sánchez 0.435 2 0.327 6 0.156 4 0.315 7 Straw 0.349 11 0.300 9 0.108 8 0.312 8 Varsho 0.420 3 0.336 3 0.155 5 0.338 3 Schneider 0.211 13 0.254 12 0.085 11 0.295 9 Sosa 0.286 12 0.214 13 0.091 10 0.203 13 MLB Average 0.387 0.316 0.148 0.318 Higher than MLB Average: Source: Baseball Savant. Data is as of May 25. The metrics I selected for the table are those with the highest correlation with scoring runs. In a prior article, I calculated regression results for the last 11 162-game regular seasons (2013-2019 and 2021-2024) with various metrics and runs. Why the focus on runs? Toronto ranks 22nd in runs per game as of May 25. Concerning the decision to make room for Barger, one of the factors the Blue Jays should consider is a player’s performance in metrics that lead to run scoring. As shown in the table, Piñango’s SLG, wOBA and OBP are better than the MLB average. Furthermore, his SLG, wOBA and OBP rankings among the 2026 Blue Jays with at least 50 plate appearances are fourth, fourth and second, respectively. His xSLG, xwOBA, and xOBP numbers are marginally below the corresponding MLB averages. Accordingly, except for ISO, Piñango’s metrics that are strongly correlated with run-scoring scream, “No Buffalo for the rookie!” However, there are other issues to consider. The table demonstrates that Piñango has generated better numbers than Lenyn Sosa. However, if Toronto removed Sosa from the 26-man roster instead of Piñango, Sosa would have to clear waivers because he has no MiLB options remaining. Given that Sosa has been awful (32 wRC+), losing him to waivers would not be catastrophic, to say the least. Nevertheless, the primary concern is that Sosa is Toronto’s only backup middle infielder. If the Blue Jays add Barger, keep Piñango and cut ties with Sosa, Toronto will have six outfielders (Piñango, Barger, Nathan Lukes, Daulton Varsho, Jesús Sánchez, and Myles Straw). Who would play second base or shortstop if Andrés Giménez or Ernie Clement were not available? Therefore, Toronto needs a backup middle infielder, but it does not need to be Sosa. Perhaps Davis Schneider can rebound after his stint in Buffalo, or a Buffalo Bison (Josh Kasevich) can replace Sosa. Of course, there is always the possibility that Toronto could add a middle infielder from the trade market. Lastly, a topic for another day is the batter-handedness of Toronto’s outfielders. Of the six, including Piñango, only one (Straw) is a right-handed batter. As of May 25, Toronto’s outfielders have a 65 wRC+ versus left-handed pitchers, which ranks 24th. Against right-handed pitchers, the Blue Jays’ outfielders have posted a 109 wRC+, good for ninth-best. At some point this season, Toronto’s management should add a lefty-masher to the outfield mix. What does this mean for Piñango when Barger returns? Unfortunately, he appears to be the one who would be Buffalo-bound. Suppose Toronto wants to carry 13 pitchers on the 26-man roster. Accordingly, there will be eight slots occupied by non-outfielders: four infielders, two catchers, one designated hitter, and one middle infielder. Hence, Toronto will deploy five outfielders. Barger, Sánchez, and Varsho should remain because they offer the power that the team needs. Lukes and Straw offer flexibility because they can play more than one outfield position well. The three primary strikes against Piñango remaining on the 26-man roster are his below-average power (ISO), his left-handed bat for a team with a surplus of left-handed-hitting outfielders, and his recent defensive woes. Hence, the game of roster musical chairs leaves Piñango standing (in Buffalo). The Last Word Piñango has had a particularly good season thus far. Since joining the big league club in April, he has produced a 112 wRC+ and a 0.4 fWAR. However, with Barger's imminent return, Toronto will have one too many outfielders, and Piñango will likely be Buffalo-bound. View full article
-
.jpg.5114cbe747dff3442088d6a30a951534.jpg) On July 27, 2024, the Blue Jays acquired Yohendrick Piñango and Josh Rivera from the Cubs in exchange for Nate Pearson. Last season, Piñango posted a 124 wRC+ with the Buffalo Bisons. However, Toronto left him off the 40-man roster before the Rule 5 draft. Fortunately for the Blue Jays, another team did not select him. Let us take a deeper dive into Piñango’s numbers. Since Piñango made his MLB debut on April 26, he has been one of the Blue Jays’ better hitters. As of May 25, his .342 OBP ranked second on the team, and his .333 wOBA and .403 SLG were the team's fourth-highest. In the field, many scouts considered his defence to be below average. Entering the May 25 game, Piñango had a 1 OAA and 0 FRV in limited innings (144). However, that evening, he misplayed two very makeable catches, which are not reflected in those OAA and FRV numbers. Also, he is not fleet of foot (44th percentile in sprint speed). For a more fulsome prospect report, please refer to the Jays Centre’s top prospect rankings. From a batted ball perspective, he is a straightaway hitter. Piñango’s pull rate is 32.7%, lower than the 37.4% MLB average. His straightaway contact rate is 43.6%, higher than the MLB average of 37.3%. Regarding opposite field rate, the MLB average is 25.1%, higher than Piñango’s 23.6% mark. He is also a contact hitter, as shown by his 83.7% contact rate (74.7% MLB average) and swings at pitches out of the zone at a 32.0% clip, slightly higher than MLB’s 30.1% average chase rate. Piñango’s strikeout, walk, and whiff rate marks are 17.1%, 5.3% and 19.9%, respectively. Those scores are lower than the corresponding MLB averages (22.1%, 9.3%, and 25.3%). Generating power is an area where Piñango lags the average MLB hitter: his .097 ISO and .099 xISO trail MLB’s average .148 ISO and .155 xISO. There are three reasons why Piñango has produced below-average power numbers. First, his pull rate lags the MLB average. On batted balls pulled, hit straightaway and to the opposite field, the MLB average ISO numbers are .312, .112 and .139, respectively. Piñango’s opportunity to generate ISO is limited due to his below-average amount of pulled contact. The second reason is launch angle. The MLB average launch angle is 13 degrees, whereas Piñango’s is 7 degrees. Consider that, on batted balls with a launch angle between 0 and 10 degrees, the average ISO and xISO are .065 and .071, respectively. Contrast those figures with launch angles between 11 and 15 degrees, on which the average ISO and xISO are .182 and .192, respectively. If Piñango could raise his average launch angle, we should observe higher ISO numbers. The third factor that negatively impacts Piñango’s power numbers is his attack angle/timing. According to the MLB website, attack angle is “in large part a timing metric, as the hitter’s attack angle is constantly changing throughout the course of the swing … When the hitter is behind the pitch with his swing (i.e., too late), he will tend to have a lower attack angle.” The MLB average attack angle is 9 degrees, but Piñango’s is -1 degree. Regarding ideal attack angle rate, his 21.9% is well below the MLB average of 48.8%. For context, the average ISO on batted balls with an attack angle between 5 and 20 degrees is .203. Concerning Piñango’s average attack angle, the MLB average ISO on batted balls with an attack angle between -1 and 4 degrees is .081. Notably, an issue for Piñango is not bat speed, as his average is 73.7 mph, faster than the MLB average of 69.8 mph. Therefore, as he gains MLB experience, if Piñango can generate a higher pull rate, launch angle and attack angle, he should post better power numbers. Now, to the question of whether Piñango should be Buffalo-bound when Barger returns, let us peek at a long-overdue table! SLG wOBA ISO OBP # Rank # Rank # Rank # Rank Lukes 0.357 10 0.309 8 0.071 13 0.328 5 Piñango 0.403 4 0.333 4 0.097 9 0.342 2 Sánchez 0.435 2 0.327 6 0.156 4 0.315 7 Straw 0.349 11 0.300 9 0.108 8 0.312 8 Varsho 0.420 3 0.336 3 0.155 5 0.338 3 Schneider 0.211 13 0.254 12 0.085 11 0.295 9 Sosa 0.286 12 0.214 13 0.091 10 0.203 13 MLB Average 0.387 0.316 0.148 0.318 Higher than MLB Average: Source: Baseball Savant. Data is as of May 25. The metrics I selected for the table are those with the highest correlation with scoring runs. In a prior article, I calculated regression results for the last 11 162-game regular seasons (2013-2019 and 2021-2024) with various metrics and runs. Why the focus on runs? Toronto ranks 22nd in runs per game as of May 25. Concerning the decision to make room for Barger, one of the factors the Blue Jays should consider is a player’s performance in metrics that lead to run scoring. As shown in the table, Piñango’s SLG, wOBA and OBP are better than the MLB average. Furthermore, his SLG, wOBA and OBP rankings among the 2026 Blue Jays with at least 50 plate appearances are fourth, fourth and second, respectively. His xSLG, xwOBA, and xOBP numbers are marginally below the corresponding MLB averages. Accordingly, except for ISO, Piñango’s metrics that are strongly correlated with run-scoring scream, “No Buffalo for the rookie!” However, there are other issues to consider. The table demonstrates that Piñango has generated better numbers than Lenyn Sosa. However, if Toronto removed Sosa from the 26-man roster instead of Piñango, Sosa would have to clear waivers because he has no MiLB options remaining. Given that Sosa has been awful (32 wRC+), losing him to waivers would not be catastrophic, to say the least. Nevertheless, the primary concern is that Sosa is Toronto’s only backup middle infielder. If the Blue Jays add Barger, keep Piñango and cut ties with Sosa, Toronto will have six outfielders (Piñango, Barger, Nathan Lukes, Daulton Varsho, Jesús Sánchez, and Myles Straw). Who would play second base or shortstop if Andrés Giménez or Ernie Clement were not available? Therefore, Toronto needs a backup middle infielder, but it does not need to be Sosa. Perhaps Davis Schneider can rebound after his stint in Buffalo, or a Buffalo Bison (Josh Kasevich) can replace Sosa. Of course, there is always the possibility that Toronto could add a middle infielder from the trade market. Lastly, a topic for another day is the batter-handedness of Toronto’s outfielders. Of the six, including Piñango, only one (Straw) is a right-handed batter. As of May 25, Toronto’s outfielders have a 65 wRC+ versus left-handed pitchers, which ranks 24th. Against right-handed pitchers, the Blue Jays’ outfielders have posted a 109 wRC+, good for ninth-best. At some point this season, Toronto’s management should add a lefty-masher to the outfield mix. What does this mean for Piñango when Barger returns? Unfortunately, he appears to be the one who would be Buffalo-bound. Suppose Toronto wants to carry 13 pitchers on the 26-man roster. Accordingly, there will be eight slots occupied by non-outfielders: four infielders, two catchers, one designated hitter, and one middle infielder. Hence, Toronto will deploy five outfielders. Barger, Sánchez, and Varsho should remain because they offer the power that the team needs. Lukes and Straw offer flexibility because they can play more than one outfield position well. The three primary strikes against Piñango remaining on the 26-man roster are his below-average power (ISO), his left-handed bat for a team with a surplus of left-handed-hitting outfielders, and his recent defensive woes. Hence, the game of roster musical chairs leaves Piñango standing (in Buffalo). The Last Word Piñango has had a particularly good season thus far. Since joining the big league club in April, he has produced a 112 wRC+ and a 0.4 fWAR. However, with Barger's imminent return, Toronto will have one too many outfielders, and Piñango will likely be Buffalo-bound.
On July 27, 2024, the Blue Jays acquired Yohendrick Piñango and Josh Rivera from the Cubs in exchange for Nate Pearson. Last season, Piñango posted a 124 wRC+ with the Buffalo Bisons. However, Toronto left him off the 40-man roster before the Rule 5 draft. Fortunately for the Blue Jays, another team did not select him. Let us take a deeper dive into Piñango’s numbers. Since Piñango made his MLB debut on April 26, he has been one of the Blue Jays’ better hitters. As of May 25, his .342 OBP ranked second on the team, and his .333 wOBA and .403 SLG were the team's fourth-highest. In the field, many scouts considered his defence to be below average. Entering the May 25 game, Piñango had a 1 OAA and 0 FRV in limited innings (144). However, that evening, he misplayed two very makeable catches, which are not reflected in those OAA and FRV numbers. Also, he is not fleet of foot (44th percentile in sprint speed). For a more fulsome prospect report, please refer to the Jays Centre’s top prospect rankings. From a batted ball perspective, he is a straightaway hitter. Piñango’s pull rate is 32.7%, lower than the 37.4% MLB average. His straightaway contact rate is 43.6%, higher than the MLB average of 37.3%. Regarding opposite field rate, the MLB average is 25.1%, higher than Piñango’s 23.6% mark. He is also a contact hitter, as shown by his 83.7% contact rate (74.7% MLB average) and swings at pitches out of the zone at a 32.0% clip, slightly higher than MLB’s 30.1% average chase rate. Piñango’s strikeout, walk, and whiff rate marks are 17.1%, 5.3% and 19.9%, respectively. Those scores are lower than the corresponding MLB averages (22.1%, 9.3%, and 25.3%). Generating power is an area where Piñango lags the average MLB hitter: his .097 ISO and .099 xISO trail MLB’s average .148 ISO and .155 xISO. There are three reasons why Piñango has produced below-average power numbers. First, his pull rate lags the MLB average. On batted balls pulled, hit straightaway and to the opposite field, the MLB average ISO numbers are .312, .112 and .139, respectively. Piñango’s opportunity to generate ISO is limited due to his below-average amount of pulled contact. The second reason is launch angle. The MLB average launch angle is 13 degrees, whereas Piñango’s is 7 degrees. Consider that, on batted balls with a launch angle between 0 and 10 degrees, the average ISO and xISO are .065 and .071, respectively. Contrast those figures with launch angles between 11 and 15 degrees, on which the average ISO and xISO are .182 and .192, respectively. If Piñango could raise his average launch angle, we should observe higher ISO numbers. The third factor that negatively impacts Piñango’s power numbers is his attack angle/timing. According to the MLB website, attack angle is “in large part a timing metric, as the hitter’s attack angle is constantly changing throughout the course of the swing … When the hitter is behind the pitch with his swing (i.e., too late), he will tend to have a lower attack angle.” The MLB average attack angle is 9 degrees, but Piñango’s is -1 degree. Regarding ideal attack angle rate, his 21.9% is well below the MLB average of 48.8%. For context, the average ISO on batted balls with an attack angle between 5 and 20 degrees is .203. Concerning Piñango’s average attack angle, the MLB average ISO on batted balls with an attack angle between -1 and 4 degrees is .081. Notably, an issue for Piñango is not bat speed, as his average is 73.7 mph, faster than the MLB average of 69.8 mph. Therefore, as he gains MLB experience, if Piñango can generate a higher pull rate, launch angle and attack angle, he should post better power numbers. Now, to the question of whether Piñango should be Buffalo-bound when Barger returns, let us peek at a long-overdue table! SLG wOBA ISO OBP # Rank # Rank # Rank # Rank Lukes 0.357 10 0.309 8 0.071 13 0.328 5 Piñango 0.403 4 0.333 4 0.097 9 0.342 2 Sánchez 0.435 2 0.327 6 0.156 4 0.315 7 Straw 0.349 11 0.300 9 0.108 8 0.312 8 Varsho 0.420 3 0.336 3 0.155 5 0.338 3 Schneider 0.211 13 0.254 12 0.085 11 0.295 9 Sosa 0.286 12 0.214 13 0.091 10 0.203 13 MLB Average 0.387 0.316 0.148 0.318 Higher than MLB Average: Source: Baseball Savant. Data is as of May 25. The metrics I selected for the table are those with the highest correlation with scoring runs. In a prior article, I calculated regression results for the last 11 162-game regular seasons (2013-2019 and 2021-2024) with various metrics and runs. Why the focus on runs? Toronto ranks 22nd in runs per game as of May 25. Concerning the decision to make room for Barger, one of the factors the Blue Jays should consider is a player’s performance in metrics that lead to run scoring. As shown in the table, Piñango’s SLG, wOBA and OBP are better than the MLB average. Furthermore, his SLG, wOBA and OBP rankings among the 2026 Blue Jays with at least 50 plate appearances are fourth, fourth and second, respectively. His xSLG, xwOBA, and xOBP numbers are marginally below the corresponding MLB averages. Accordingly, except for ISO, Piñango’s metrics that are strongly correlated with run-scoring scream, “No Buffalo for the rookie!” However, there are other issues to consider. The table demonstrates that Piñango has generated better numbers than Lenyn Sosa. However, if Toronto removed Sosa from the 26-man roster instead of Piñango, Sosa would have to clear waivers because he has no MiLB options remaining. Given that Sosa has been awful (32 wRC+), losing him to waivers would not be catastrophic, to say the least. Nevertheless, the primary concern is that Sosa is Toronto’s only backup middle infielder. If the Blue Jays add Barger, keep Piñango and cut ties with Sosa, Toronto will have six outfielders (Piñango, Barger, Nathan Lukes, Daulton Varsho, Jesús Sánchez, and Myles Straw). Who would play second base or shortstop if Andrés Giménez or Ernie Clement were not available? Therefore, Toronto needs a backup middle infielder, but it does not need to be Sosa. Perhaps Davis Schneider can rebound after his stint in Buffalo, or a Buffalo Bison (Josh Kasevich) can replace Sosa. Of course, there is always the possibility that Toronto could add a middle infielder from the trade market. Lastly, a topic for another day is the batter-handedness of Toronto’s outfielders. Of the six, including Piñango, only one (Straw) is a right-handed batter. As of May 25, Toronto’s outfielders have a 65 wRC+ versus left-handed pitchers, which ranks 24th. Against right-handed pitchers, the Blue Jays’ outfielders have posted a 109 wRC+, good for ninth-best. At some point this season, Toronto’s management should add a lefty-masher to the outfield mix. What does this mean for Piñango when Barger returns? Unfortunately, he appears to be the one who would be Buffalo-bound. Suppose Toronto wants to carry 13 pitchers on the 26-man roster. Accordingly, there will be eight slots occupied by non-outfielders: four infielders, two catchers, one designated hitter, and one middle infielder. Hence, Toronto will deploy five outfielders. Barger, Sánchez, and Varsho should remain because they offer the power that the team needs. Lukes and Straw offer flexibility because they can play more than one outfield position well. The three primary strikes against Piñango remaining on the 26-man roster are his below-average power (ISO), his left-handed bat for a team with a surplus of left-handed-hitting outfielders, and his recent defensive woes. Hence, the game of roster musical chairs leaves Piñango standing (in Buffalo). The Last Word Piñango has had a particularly good season thus far. Since joining the big league club in April, he has produced a 112 wRC+ and a 0.4 fWAR. However, with Barger's imminent return, Toronto will have one too many outfielders, and Piñango will likely be Buffalo-bound. -
.jpg.97d64c1b98e7d600951d5ee04f9afe10.jpg) Before the 2026 season, Jesús Sánchez generated a .181 ISO in his six-year MLB career. That ISO ranks in the 66th percentile among the 382 hitters with at least 1,000 plate appearances during that period. Accordingly, it is easy to understand why the Blue Jays would be interested in Sánchez’s power. Despite his history, Sánchez has not delivered the expected power so far this season. After the May 10 game against the Angels, his ISO was .157, above the .148 MLB average. However, that .157 includes his home run when he faced second baseman, Adam Frazier, who entered the May 9 game in the eighth inning as a fill-in pitcher for the Angels with Toronto holding a 10-1 lead. Before May 9, Sánchez's ISO was .140, which was below expectations. Overall, his 2026 wRC+ is 87, but his .318 xwOBA corresponds with a 100 wRC+. Therefore, it appears that Lady Luck has not looked favourably upon Sánchez thus far this season. Could luck be a factor that explains the ISO drop from the pre-2026 version of Sánchez? No, there are other aspects to consider, which are as follows: Chasing Contact Sprint Speed Bat Tracking The best way to address Sánchez’s power loss is to lay out the data all at once. Yes, table time! In fact, two tables! Table 1 shows the ISO (SLG minus BA) and xISO (xSLG minus xBA) for Sánchez for 2026 and for the 2023-2025 period, in total and by zone. The shadow zone is the width of two baseballs: one baseball lies in the strike zone, and one baseball is outside. Also, observe that Sánchez’s xISO has consistently exceeded his ISO, suggesting that perhaps Lady Luck (a positive xISO-ISO delta) does not explain the 2026 ISO underperformance. Table 2 displays his swing rate and chase rate by attack zone. Now to the analysis! Table 1 All Zones In-Zone Out-of-Zone Heart Zone Shadow Zone Chase Zone xISO Sánchez - 2026 0.169 0.202 0.113 0.163 0.215 0.059 Sánchez - 2023 to 2025 0.211 0.291 0.044 0.373 0.133 0.030 MLB - 2023 to 2025 0.167 0.210 0.053 0.258 0.117 0.023 ISO Sánchez - 2026 0.157 0.158 0.156 0.093 0.207 0.176 Sánchez - 2023 to 2025 0.172 0.231 0.048 0.294 0.112 0.039 MLB - 2023 to 2025 0.159 0.198 0.056 0.241 0.116 0.026 Source: Baseball Savant. Sánchez's 2026 data is as of May 10. Table 2 Swing% Contact% Heart Shadow Chase Waste Heart Shadow Chase Waste Sánchez - 2026 76.9 64.9 36.0 12.8 84.3 81.5 69.4 0.0 Sánchez - 2023 to 2025 76.6 56.1 27.6 12.1 86.3 73.5 44.6 8.6 MLB - 2023 to 2025 75.8 57.0 27.3 10.8 86.5 73.4 45.8 7.2 MLB ISO - 2023 to 2025 0.241 0.116 0.026 0.001 Source: Baseball Savant. Sánchez's 2026 data is as of May 5. Chasing Contact Sánchez has increased both the rate at which he swings at pitches and the rate at which he makes contact this season compared to the 2023-2025 period. Overall, his 2026 swing rate and contact rate are 54.5% and 77.6%, respectively, which are higher than his 50.5% swing rate and 73.1% contact rate during the 2023-2025 period. One of the benefits of a higher contact rate is a lower K%: Sánchez’s 2026 strikeout rate is 20.3%, lower than his 2023-2025 24.9% strikeout rate. Unsurprisingly, the higher swing rate and contact rate this season have led to a lower walk rate (4.5%) than during the 2023-2025 seasons (8.4%). Furthermore, Sánchez’s average 2026 bat speed is 73.0 mph (62nd percentile), which is slower than his 2025 mark of 75.9 mph (93rd percentile). A reduced bat speed is consistent with a batter who wants to increase his contact rate. However, the higher swing rate and contact rate have resulted in lower ISO and xISO numbers. As Table 2 shows, his swing rates have risen in the non-power zones: shadow, chase, and waste. Under the Contact% numbers, note the average ISO numbers for the four zones. On average, hitters generate more power on pitches in the heart zone than in the shadow, chase, and waste zones. From a contact perspective, the higher contact rates in the shadow and chase zones have contributed to Sánchez’s 2026 power decline. To illustrate this point, I recalculated Sánchez’s 2026 ISO and xISO using his 2023-2025 swing rates and his 2026 contact rates. Also, I held the total number of swings in 2026 constant and applied the relevant 2026 ISO/xISO per-swing numbers. In other words, based on the swing-rate differences between the 2023-2025 seasons and 2026, I transferred 18 swings from the waste, the chase, and the outer part of the shadow zone to the heart zone and the inner part of the shadow zone. I performed a similar transfer from the out-of-zone swings to the in-zone swings. The results of the calculation are not surprising. If Sánchez had his 2023-2025 swing rates, combined with his 2026 contact rates, his 2026 ISO would be .160, instead of .157. His 2026 xISO would rise from .169 to .182. As a check, I performed the same calculation using the gameday zones (in and out of the strike zone), and the results were identical (.160 ISO and .182 xISO). In summary, part of the reason Sánchez’s ISO and xISO numbers are below his 2023-2025 marks is that he is swinging too much and making more contact in the non-power zones (shadow, chase, and waste). Sprint Speed The second piece of the puzzle. Extra-base hits include doubles, triples, and home runs. Given that Sánchez has averaged less than two triples per season, he is not a triples threat. Accordingly, I will focus on home runs and doubles. So far in 2026, Sánchez has hit a home run every 24.2 at-bats, better than he did during the 2023-2025 period (every 28.3 at-bats). The MLB average from 2023 to 2025 was one homer every 29.0 at-bats. Historically, Sánchez has hit a home run at a slightly faster pace than the MLB average. Therefore, his power decline is reflected in his doubles. His at-bats divided by doubles rates are 15.7, 19.6 and 21.5 in 2023, 2024, and 2025, respectively. The 2023-2025 MLB average is 18.8 at-bats per double. Thus far in 2026, Sánchez’s doubles rate is one double every 30.3 at-bats. One reason his doubles rate has declined could be his diminished foot speed. His sprint speed percentile rankings are 54th, 46th, 40th, and 18th in 2023, 2024, 2025, and 2026, respectively. Because foot speed and hitting with power contribute to producing doubles, Sánchez’s sprint speed decline could be a reason his rate of hitting doubles has dropped. Bat Tracking A barreled ball is determined by a combination of exit velocity and launch angle. During the 2023-2025 period, Sánchez had above-average barrel rates, both in barrels/BBE (batted ball event) and in barrels/PA (plate appearance). Thus far in 2026, his barrels/BBE rate is 7.2%, down from 11.8% during 2023-2025. The MLB average is 8.2%. Concerning his barrels/PA rate, he posted a 7.8% in 2023-2025, higher than 2026’s 5.3%. The MLB average was 5.5%. What is going on? It is not the 98-mph exit velocity requirement for a batted ball. Concerning batted balls meeting the 98 mph or faster requirement, Sánchez’s 2026 rate (37%) is similar to his 2023-2025 rate (39%). Therefore, the reduced 2026 barrel rates must be due to a lower rate of batted balls that meet the launch angle requirement. What could explain the lower rate of required launch angle on batted balls that would otherwise be barreled balls? It could be a notable change in Sánchez’s ideal attack angle, but his 2026 overall ideal attack angle rate is 48.9%, a tick lower than his 49.1% rate during the 2023-2025 period. Given that there is only a minor change in this area, Sánchez’s underlying swing mechanics do not explain the reduced barrel rates. Unfortunately, I do not have any insights into the reduced barrel rates beyond the issue of small sample size, which is a legitimate explanation. Thus far in 2026, Sánchez has barreled seven pitches out of 97 batted ball events. If he had four more barreled balls, his 2026 barrel rates would be like those of the 2023-2025 period. Do not despair. The small sample is a positive indicator. Given Sánchez’s ideal attack angle history and his above-average exit velocity record, he should start to barrel balls at a rate consistent with the 2023-2025 period. The Last Word Before joining the Toronto Blue Jays, Jesús Sánchez was a hitter with above-average power. However, thus far this season, his power production has been below expectations. Many factors help explain Sánchez’s reduced power numbers. The primary reason is higher swing and contact rates in zones that typically produce lower power numbers (for example, the shadow and chase zones). Another cause is a decline in foot speed. The final factor is the small size of the sample. Hence, for the balance of the 2026 season, with more plate discipline (by chasing less) and a regression to his historical barrel rates and bat tracking metrics, Sánchez should return to his previous status as the power hitter the Blue Jays thought they were acquiring before this season began.
Before the 2026 season, Jesús Sánchez generated a .181 ISO in his six-year MLB career. That ISO ranks in the 66th percentile among the 382 hitters with at least 1,000 plate appearances during that period. Accordingly, it is easy to understand why the Blue Jays would be interested in Sánchez’s power. Despite his history, Sánchez has not delivered the expected power so far this season. After the May 10 game against the Angels, his ISO was .157, above the .148 MLB average. However, that .157 includes his home run when he faced second baseman, Adam Frazier, who entered the May 9 game in the eighth inning as a fill-in pitcher for the Angels with Toronto holding a 10-1 lead. Before May 9, Sánchez's ISO was .140, which was below expectations. Overall, his 2026 wRC+ is 87, but his .318 xwOBA corresponds with a 100 wRC+. Therefore, it appears that Lady Luck has not looked favourably upon Sánchez thus far this season. Could luck be a factor that explains the ISO drop from the pre-2026 version of Sánchez? No, there are other aspects to consider, which are as follows: Chasing Contact Sprint Speed Bat Tracking The best way to address Sánchez’s power loss is to lay out the data all at once. Yes, table time! In fact, two tables! Table 1 shows the ISO (SLG minus BA) and xISO (xSLG minus xBA) for Sánchez for 2026 and for the 2023-2025 period, in total and by zone. The shadow zone is the width of two baseballs: one baseball lies in the strike zone, and one baseball is outside. Also, observe that Sánchez’s xISO has consistently exceeded his ISO, suggesting that perhaps Lady Luck (a positive xISO-ISO delta) does not explain the 2026 ISO underperformance. Table 2 displays his swing rate and chase rate by attack zone. Now to the analysis! Table 1 All Zones In-Zone Out-of-Zone Heart Zone Shadow Zone Chase Zone xISO Sánchez - 2026 0.169 0.202 0.113 0.163 0.215 0.059 Sánchez - 2023 to 2025 0.211 0.291 0.044 0.373 0.133 0.030 MLB - 2023 to 2025 0.167 0.210 0.053 0.258 0.117 0.023 ISO Sánchez - 2026 0.157 0.158 0.156 0.093 0.207 0.176 Sánchez - 2023 to 2025 0.172 0.231 0.048 0.294 0.112 0.039 MLB - 2023 to 2025 0.159 0.198 0.056 0.241 0.116 0.026 Source: Baseball Savant. Sánchez's 2026 data is as of May 10. Table 2 Swing% Contact% Heart Shadow Chase Waste Heart Shadow Chase Waste Sánchez - 2026 76.9 64.9 36.0 12.8 84.3 81.5 69.4 0.0 Sánchez - 2023 to 2025 76.6 56.1 27.6 12.1 86.3 73.5 44.6 8.6 MLB - 2023 to 2025 75.8 57.0 27.3 10.8 86.5 73.4 45.8 7.2 MLB ISO - 2023 to 2025 0.241 0.116 0.026 0.001 Source: Baseball Savant. Sánchez's 2026 data is as of May 5. Chasing Contact Sánchez has increased both the rate at which he swings at pitches and the rate at which he makes contact this season compared to the 2023-2025 period. Overall, his 2026 swing rate and contact rate are 54.5% and 77.6%, respectively, which are higher than his 50.5% swing rate and 73.1% contact rate during the 2023-2025 period. One of the benefits of a higher contact rate is a lower K%: Sánchez’s 2026 strikeout rate is 20.3%, lower than his 2023-2025 24.9% strikeout rate. Unsurprisingly, the higher swing rate and contact rate this season have led to a lower walk rate (4.5%) than during the 2023-2025 seasons (8.4%). Furthermore, Sánchez’s average 2026 bat speed is 73.0 mph (62nd percentile), which is slower than his 2025 mark of 75.9 mph (93rd percentile). A reduced bat speed is consistent with a batter who wants to increase his contact rate. However, the higher swing rate and contact rate have resulted in lower ISO and xISO numbers. As Table 2 shows, his swing rates have risen in the non-power zones: shadow, chase, and waste. Under the Contact% numbers, note the average ISO numbers for the four zones. On average, hitters generate more power on pitches in the heart zone than in the shadow, chase, and waste zones. From a contact perspective, the higher contact rates in the shadow and chase zones have contributed to Sánchez’s 2026 power decline. To illustrate this point, I recalculated Sánchez’s 2026 ISO and xISO using his 2023-2025 swing rates and his 2026 contact rates. Also, I held the total number of swings in 2026 constant and applied the relevant 2026 ISO/xISO per-swing numbers. In other words, based on the swing-rate differences between the 2023-2025 seasons and 2026, I transferred 18 swings from the waste, the chase, and the outer part of the shadow zone to the heart zone and the inner part of the shadow zone. I performed a similar transfer from the out-of-zone swings to the in-zone swings. The results of the calculation are not surprising. If Sánchez had his 2023-2025 swing rates, combined with his 2026 contact rates, his 2026 ISO would be .160, instead of .157. His 2026 xISO would rise from .169 to .182. As a check, I performed the same calculation using the gameday zones (in and out of the strike zone), and the results were identical (.160 ISO and .182 xISO). In summary, part of the reason Sánchez’s ISO and xISO numbers are below his 2023-2025 marks is that he is swinging too much and making more contact in the non-power zones (shadow, chase, and waste). Sprint Speed The second piece of the puzzle. Extra-base hits include doubles, triples, and home runs. Given that Sánchez has averaged less than two triples per season, he is not a triples threat. Accordingly, I will focus on home runs and doubles. So far in 2026, Sánchez has hit a home run every 24.2 at-bats, better than he did during the 2023-2025 period (every 28.3 at-bats). The MLB average from 2023 to 2025 was one homer every 29.0 at-bats. Historically, Sánchez has hit a home run at a slightly faster pace than the MLB average. Therefore, his power decline is reflected in his doubles. His at-bats divided by doubles rates are 15.7, 19.6 and 21.5 in 2023, 2024, and 2025, respectively. The 2023-2025 MLB average is 18.8 at-bats per double. Thus far in 2026, Sánchez’s doubles rate is one double every 30.3 at-bats. One reason his doubles rate has declined could be his diminished foot speed. His sprint speed percentile rankings are 54th, 46th, 40th, and 18th in 2023, 2024, 2025, and 2026, respectively. Because foot speed and hitting with power contribute to producing doubles, Sánchez’s sprint speed decline could be a reason his rate of hitting doubles has dropped. Bat Tracking A barreled ball is determined by a combination of exit velocity and launch angle. During the 2023-2025 period, Sánchez had above-average barrel rates, both in barrels/BBE (batted ball event) and in barrels/PA (plate appearance). Thus far in 2026, his barrels/BBE rate is 7.2%, down from 11.8% during 2023-2025. The MLB average is 8.2%. Concerning his barrels/PA rate, he posted a 7.8% in 2023-2025, higher than 2026’s 5.3%. The MLB average was 5.5%. What is going on? It is not the 98-mph exit velocity requirement for a batted ball. Concerning batted balls meeting the 98 mph or faster requirement, Sánchez’s 2026 rate (37%) is similar to his 2023-2025 rate (39%). Therefore, the reduced 2026 barrel rates must be due to a lower rate of batted balls that meet the launch angle requirement. What could explain the lower rate of required launch angle on batted balls that would otherwise be barreled balls? It could be a notable change in Sánchez’s ideal attack angle, but his 2026 overall ideal attack angle rate is 48.9%, a tick lower than his 49.1% rate during the 2023-2025 period. Given that there is only a minor change in this area, Sánchez’s underlying swing mechanics do not explain the reduced barrel rates. Unfortunately, I do not have any insights into the reduced barrel rates beyond the issue of small sample size, which is a legitimate explanation. Thus far in 2026, Sánchez has barreled seven pitches out of 97 batted ball events. If he had four more barreled balls, his 2026 barrel rates would be like those of the 2023-2025 period. Do not despair. The small sample is a positive indicator. Given Sánchez’s ideal attack angle history and his above-average exit velocity record, he should start to barrel balls at a rate consistent with the 2023-2025 period. The Last Word Before joining the Toronto Blue Jays, Jesús Sánchez was a hitter with above-average power. However, thus far this season, his power production has been below expectations. Many factors help explain Sánchez’s reduced power numbers. The primary reason is higher swing and contact rates in zones that typically produce lower power numbers (for example, the shadow and chase zones). Another cause is a decline in foot speed. The final factor is the small size of the sample. Hence, for the balance of the 2026 season, with more plate discipline (by chasing less) and a regression to his historical barrel rates and bat tracking metrics, Sánchez should return to his previous status as the power hitter the Blue Jays thought they were acquiring before this season began. -
Before the 2026 season, Jesús Sánchez generated a 0.181 ISO in his six-year MLB career. That ISO ranks in the 66th percentile among the 382 hitters with at least 1,000 plate appearances during that period. Accordingly, it is easy to understand why the Blue Jays would be interested in Sánchez’s power. Despite his history, Sánchez has not delivered the expected power so far this season. After the May 5 game against Tampa, Sánchez’s ISO was 0.143, below the 0.150 2026 MLB Average. Overall, his 2026 wRC+ is 78, but his 0.325 xwOBA corresponds with a 105 wRC+. Therefore, it appears that Lady Luck has not looked favourably upon Sánchez thus far this season. Is luck the only factor that explains the ISO drop from the pre-2026 version of Sánchez? No, there are other aspects to consider, which are as follows: Chasing Contact Timing Sprint Speed The best way to address Sánchez’s power loss is to lay out the data all at once. Yes, table time! In fact, three tables! Table 1 shows the ISO (SLG minus BA) and xISO (xSLG minus xBA) for Sánchez for 2026 and the 2023-2025 period by pitch type. Notably, the pitch mix Sánchez has faced in 2026 is like that in prior seasons, as is the pitch location (2026 versus 2025). The first observation from this table is that Sánchez’s xISO has consistently exceeded his ISO, suggesting that perhaps Lady Luck does not explain the 2026 xISO-ISO difference. Second, his 2026 xISO on fastballs and offspeed pitches lags Sánchez’s 2023-2025 numbers. This latter issue will be addressed in the Timing section. Table 2 displays the Swing% and Chase% by attack zone. Lastly, Table 3 shows the ISO and xISO metrics by attack and game-day zones. Now to the analysis! .report-table-wrap{ width:1800px; margin:0 auto 40px auto; font-family:Arial, Helvetica, sans-serif; background:#fff; color:#000; } .report-table{ width:100%; border-collapse:collapse; table-layout:fixed; font-size:28px; text-align:center; } Table 1 All Pitches Fastballs (57.0%) Breaking (24.9%) Offspeed (18.1%) xISO Sánchez 2026 0.174 0.184 0.207 0.057 Sánchez 2023-2025 0.211 0.228 0.223 0.147 MLB 2023-2025 0.167 0.188 0.148 0.133 ISO Sánchez 2026 0.143 0.172 0.154 0.000 Sánchez 2023-2025 0.172 0.189 0.148 0.167 MLB 2023-2025 0.159 0.171 0.153 0.135 Source: Baseball Savant. Sánchez's 2026 data is as of May 5, as are the pitch mix numbers. Table 2 Swing% Contact% Heart Shadow Chase Waste Heart Shadow Chase Waste Sánchez 2026 76.9 64.9 36.0 12.8 84.3 81.5 69.4 0.0 Sánchez 2023-2025 76.6 56.1 27.6 12.1 86.3 73.5 44.6 8.6 MLB 2023-2025 75.8 57.0 27.3 10.8 86.5 73.4 45.8 7.2 MLB ISO 2023-2025 0.241 0.116 0.026 0.001 Source: Baseball Savant. Sánchez's 2026 data is as of May 5. Table 3 In-Zone Out-of- Zone Heart Zone Shadow Zone Chase Zone xISO Sánchez 2026 0.216 0.102 0.179 0.223 0.007 Sánchez 2023-2025 0.291 0.044 0.373 0.133 0.030 MLB 2023-2025 0.210 0.053 0.258 0.117 0.023 ISO Sánchez 2026 0.169 0.098 0.103 0.214 0.000 Sánchez 2023-2025 0.231 0.048 0.294 0.112 0.039 MLB 2023-2025 0.198 0.056 0.241 0.116 0.026 Source: Baseball Savant. Sánchez's 2026 data is as of May 5. Chasing Contact It appears that Sánchez has focused on increasing both the rates at which he swings at pitches and makes contact this season compared to the 2023-2025 period. Overall, his 2026 Swing% and Contact% are 55.8% and 78.7%, respectively, which are higher than his 50.5% Swing% and 73.1% Contact% during the 2023-2025 period. One of the benefits of a higher contact rate is a lower K%: Sánchez’s 2026 K% is 18.7%, lower than the 2023-2025 24.9% strikeout rate. Unsurprisingly, the higher Swing% and Contact% this season have led to a lower walk rate (4.1%) than during the 2023-2025 seasons (8.4%). Furthermore, Sánchez’s average 2026 bat speed is 73.1 mph (64th percentile), which is lower than his 2025 mark of 75.9 mph (93rd percentile). A reduced bat speed is consistent with a batter who wants to increase his contact rate. However, the higher Swing% and Contact% have resulted in lower ISO and xISO numbers. As Table 2 shows, the Swing and Contact rates have risen in the non-power zones: Shadow, Chase, and Waste. Under the Contact% numbers, note the average ISO numbers for the four zones. On average, hitters generate more power on pitches in the Heart Zone than in the Shadow, Chase, and Waste zones. From a contact perspective, the higher Contact% in the Shadow and Chase zones have contributed to Sánchez’s 2026 power decline. To illustrate this point, I recalculated Sánchez’s 2026 ISO and xISO using his 2023-2025 swing rates and his 2026 contact rates. Also, I held the number of 2026 swings constant. In other words, based on the swing-rate differences between the 2023-2025 seasons and 2026, I transferred some swings from the Waste, the Chase, and the outer part of the Shadow Zone to the Heart Zone and the inner part of the Shadow Zone. The results of the calculation are not surprising. If Sánchez had his 2023-2025 swing rates, combined with his 2026 contact rates, his 2026 ISO would be 0.156, instead of 0.143. His 2026 xISO would rise from 0.174 to 0.194. As a check, I performed the same calculation using the Game Day Zones (in and out of the strike zone), and the results were identical (0.156 ISO and 0.194 xISO). In summary, part of the reason Sánchez’s ISO and xISO numbers are below his 2023-2025 marks is that he is swinging too much and making more contact in the non-power zones (Shadow, Chase, and Waste). Timing Concerning batting stance and positioning, Sánchez has made changes in 2026. In 2025, his stance was open, 10 degrees. This season, Sánchez is more open (14 degrees). Also, he has narrowed his stance (distance between feet) from 34.9 inches last season to 29.4 inches in 2026. Hence, in the early stage of stance and positioning changes, a batter’s timing can be affected. How do timing issues affect a batter’s power? One of the new Baseball Savant metrics is Ideal Attack Angle, which is a swing angle that is between 5° and 20°. Why is attack angle important? Because swings “in the ideal attack angle range are much more likely to produce line drives and fly balls, resulting in significantly higher slugging percentage and more extra-base hits.” Furthermore, a “hitter's ideal attack angle rate is the percentage of his competitive swings that fall within the 5-20° attack angle range.” Lastly, the ideal attack angle is “largely reflective of the hitter’s timing.” How has Sánchez’s Ideal Attack Angle percentage changed from the 2023-2025 period? His average Ideal Attack Angle percentage from 2023 to 2025 was 49.1%, below MLB’s 51.0%. In 2026, his Ideal Attack Angle percentage is 46.9%. Accordingly, Sánchez’s lower Ideal Attack Angle percentage in 2026 is consistent with his lower ISO and xISO numbers. Tying everything together, the stance and positioning changes Sánchez has adopted thus far in 2026 may have affected his timing, resulting in a lower Ideal Attack Angle percentage and, thereby, a lower ISO and xISO. Furthermore, timing issues would be consistent with lower xISO on fastballs and offspeed pitches, not to mention, less power generated on batted balls located in the Heart Zone, and the Game Day In-Zone. Phew, that is a lot of tying up! But it makes sense given the data. Sprint Speed The last piece of the puzzle. Extra-base hits include doubles, triples, and home runs. Given that Sánchez has averaged less than two triples per season, he is not a triples threat. Accordingly, I will focus on home runs and doubles. So far in 2026, Sánchez has hit a home run every 28.3 at-bats, the same as he did during the 2023-2025 period. The MLB average from 2023 to 2025 was one homer every 29.0 at-bats. Historically, Sánchez has hit a home run at a slightly faster pace than the MLB average. Therefore, Sánchez’s power decline is reflected in his doubles. His at-bats divided by doubles rates are 15.7, 19.6 and 21.5 in 2023, 2024, and 2025, respectively. The 2023-2025 MLB average is 18.8 at-bats per double. Thus far in 2026, Sánchez’s doubles rate is one double every 28.3 at-bats. One reason his doubles rate has declined could be his diminished foot speed. His Sprint Speed percentile rankings are 54th, 46th, 40th, and 21st in 2023, 2024, 2025, and 2026, respectively. Because foot speed and hitting with power contribute to producing doubles, Sánchez’s Sprint Speed decline could be a reason his rate of hitting doubles has dropped. The Last Word Before joining the Toronto Blue Jays, Sánchez was a hitter with above-average power. However, thus far this season, his power production has been below expectations. Many factors help explain Sánchez’s reduced power numbers. The primary reason is higher swing and contact rates in zones that typically produce lower power numbers (for example, the Shadow and Chase zones). Another cause is an emphasis on contact at the expense of bat speed. The other factors are timing issues caused by changes to batting stance and positioning, and a decline in foot speed. However, despite these issues, Sánchez should be able to adjust, allowing him to be the power hitter the Blue Jays thought they were acquiring before this season began. View full article
-
 Jays Centre is taking a close look at every position on the Toronto Blue Jays heading into the 2026 season. Check out prior entries in the series here: Catcher First Base Second Base Shortstop Third Base Left Field Right Field DH Toronto Blue Jays Center Fielders at a Glance Starter: Daulton Varsho Backup: Myles Straw Depth: Nathan Lukes, Jonatan Clase Prospects: RJ Schreck, Jace Bohrofen Blue Jays Center Field fWAR in 2025: 4th out of 30 (4.4) Blue Jays Center Field FGDC Projection for 2026: 12th (3.0) For the 2021-2025 period, Toronto’s fWAR production from center fielders ranks sixth-highest (16.2 fWAR). The best fWAR during these seasons was generated by the Mariners (23.8); the next-closest was the Yankees (22.3). During those seasons, Toronto’s highest ranking was fourth place in 2025; the lowest in 2024 (21st). Overall, exceptional performance. So, what does 2026 look like for Toronto’s center fielders? The Good Oh, yes, there are tables! The first is a summary of FanGraphs Depth Charts' 2026 projection for Toronto’s outfielders. According to Depth Charts’ estimate, Blue Jays center fielders will produce the 12th-highest fWAR among MLB teams. That projected performance lags two of Toronto’s American League East rivals: the Yankees (3.9) and Red Sox (3.7). There are good reasons to believe that Toronto’s center fielders will perform better than the projected 3.0 fWAR. More on this later. 2026 Projected fWAR LF RF CF OF Daulton Varsho 2.7 2.7 Nathan Lukes 0.6 0.4 0.2 1.2 Myles Straw - - 0.1 0.1 Jesús Sánchez 1.2 0.2 1.4 Addison Barger 1.0 1.0 Davis Schneider 0.4 0.4 George Springer 0.1 0.6 0.7 Projected 2026 total 2.4 2.3 3.0 7.7 2025 total 2.6 1.9 4.4 8.9 Toronto's Projected Rank - 2026 11 12 12 14 Toronto's Rank - 2025 13 13 4 7 Source: Depth Charts courtesy of FanGraphs The second table shows the career and 2025 OAA and FRV values for the center fielders. Last season, due to injuries (shoulder and hamstring ailments), Varsho accumulated 550 innings in center field for the Blue Jays. That innings number was 38% of Toronto’s center field total (1,438). Defensively, Straw was superb, as evidenced by his 16 OAA/1200 and 16 FRV/1200 scores. Concerning Lukes, his OAA in center field was -1 in 214 innings, but his FRV was zero because his throwing added one run. Hence, Lukes’ overall center field performance was average. Center Field Innings Center Field OAA Per 1200 Center Field FRV Per 1200 Career 2025 Career 2025 Career 2025 Daulton Varsho 2,375 550 16 20 17 13 Nathan Lukes 246 214 -15 -6 -15 0 Myles Straw 4,695 532 9 16 9 16 Source: FanGraphs Regarding Varsho, his decline in arm strength was an issue in 2025. Consider the next table. Please note that the innings shown for each player reflect innings played at all positions (Baseball Savant does not separate the Arm Value numbers by position). However, the Arm Strength numbers shown in the table concern only center field play. After the 2024 campaign, Varsho underwent shoulder surgery and did not play again until April 29, 2025. Upon his return, it was evident that Varsho’s arm strength, which was below average before 2025, was weaker. His Arm Strength was 83.7 mph in 2024, but averaged 73.7 mph in 2025. Among the 44 center fielders with at least 100 throws, Varsho’s 2025 73.7 mph ranked last. In 2024, his arm strength ranked 50th out of 54 center fielders. Outfield Innings Arm Value Per 1200 Fielder Runs Arm Strength (mph) Career 2025 Career 2025 Daulton Varsho 4,330 550 2 -4 -2 73.7 Nathan Lukes 1,150 909 6 5 4 87.0 Myles Straw 4,931 698 0 0 0 82.9 MLB Center Fielder Average 89.6 Source: FanGraphs & Baseball Savant More Good In 2025, Toronto batters had 6,180 plate appearances, 1,680 (26%) of which were against left-handed pitchers. Blue Jays’ center fielders produced a 103 wRC+ (ninth-highest) versus lefties. Overall, Toronto’s center fielders posted a 113 wRC+ (fourth-best), including a 116 wRC+ when facing right-handers (MLB’s 10th best). At the player level, when playing center field, the details are as follows: The standout was Lukes, who posted a 141 wRC+, followed by Varsho (125) and Straw (88). Concerning plate appearances when facing left-handed pitchers, Lukes, Varsho, and Straw had plate appearances totals of 10, 55 and 94, respectively. Their wRC+ scores were 132, 101, and 105, respectively. Regarding wRC+ results against right-handed pitchers, Lukes, Varsho, and Straw generated wRC+ scores of 142, 131 and 88, respectively. They produced their wRC+ numbers in 99, 209 and 123 plate appearances, respectively. For the three center fielders, those 2025 wRC+ numbers are noticeably better than their career splits (when playing all positions). Consider the next table. Career Plate Appearances Career wRC+ LHP RHP Total LHP RHP Overall Daulton Varsho 532 1,855 2,387 90 101 99 Nathan Lukes 72 488 560 83 109 106 Myles Straw 707 1,572 2,279 74 83 80 Source: FanGraphs Let’s look on the bright side. It would be nice if Lukes and Straw replicated their 2025 wRC+ numbers this upcoming season. However, the critical center field bat for the Blue Jays is Varsho. Suppose we are witnessing the emergence of Varsho as an above-average MLB hitter. Before 2025, Varsho generated career wOBA, xwOBA and wRC+ scores of .308, .295 and 96, respectively. In 2025, he produced a .345 wOBA, .327 xwOBA and 123 wRC+. The Depth Charts projected fWAR includes a .315 wOBA for Varsho (in 2025, the MLB average wOBA was .313). Suppose the new Varsho produces a .327 wOBA (his 2025 xwOBA) in 2026; his fWAR estimate rises from 2.7 to 3.2. Furthermore, the Depth Charts' 2.7 fWAR figure includes a 4.5 Def for Varsho. Suppose Varsho plays 1,220 innings in center field in 2026, which corresponds to a 2.0 Positional Adjustment. Accordingly, Varsho’s projected Fielding Runs number is 2.5 (4.5 Def less 2.0 positional adjustment). That Fielding Runs number seems low. In 2025, Varsho’s Fielding Runs figure was 3.9 in 550 innings. In 2024 and 2023, his Fielding Runs were 13.7 and 11.4, respectively. If Varsho’s 2026 Fielding Runs are, for example, 10.0, his projected 2026 fWAR increases from 2.7 to 3.5. Together with the estimated 0.5 fWAR bump from the .327 wOBA, Varsho’s 2026 fWAR would be 4.0 (all other things being equal). Suppose Varsho’s 2026 fWAR is 4.0. Toronto’s estimated total center field fWAR rises from 3.0 to 4.3. A 4.3 fWAR would move the Blue Jays’ center field group back up to the fourth-highest fWAR ranking, which it held in 2025. The Bad The key to Toronto’s 2026 center field success is Varsho. If his arm strength does not return to its 2024 level, Varsho’s defensive production will suffer. Furthermore, if Varsho does not remain a very good MLB hitter this season, as he was in 2025, Toronto’s center field crew will underperform at the plate. The Last Word FanGraphs Depth Charts' 2026 center field projection places Toronto at 12th (3.0 fWAR), which lags the team's fourth-best ranking from 2025. I believe the FGDC estimate is on the low side. If Varsho plays a full season and replicates his 2025 hitting and fielding performance, the Blue Jays should have one of the top center field crews in MLB. Defence, particularly with Varsho and Straw, should be elite. The critical question is whether their bats can excel like they did last season.
 -
Jays Centre is taking a close look at every position on the Toronto Blue Jays heading into the 2026 season. Check out prior entries in the series here: Catcher First Base Second Base Shortstop Third Base Left Field Right Field DH Toronto Blue Jays Center Fielders at a Glance Starter: Daulton Varsho Backup: Myles Straw Depth: Nathan Lukes, Jonatan Clase Prospects: RJ Schreck, Jace Bohrofen Blue Jays Center Field fWAR in 2025: 4th out of 30 (4.4) Blue Jays Center Field FGDC Projection for 2026: 12th (3.0) For the 2021-2025 period, Toronto’s fWAR production from center fielders ranks sixth-highest (16.2 fWAR). The best fWAR during these seasons was generated by the Mariners (23.8); the next-closest was the Yankees (22.3). During those seasons, Toronto’s highest ranking was fourth place in 2025; the lowest in 2024 (21st). Overall, exceptional performance. So, what does 2026 look like for Toronto’s center fielders? The Good Oh, yes, there are tables! The first is a summary of FanGraphs Depth Charts' 2026 projection for Toronto’s outfielders. According to Depth Charts’ estimate, Blue Jays center fielders will produce the 12th-highest fWAR among MLB teams. That projected performance lags two of Toronto’s American League East rivals: the Yankees (3.9) and Red Sox (3.7). There are good reasons to believe that Toronto’s center fielders will perform better than the projected 3.0 fWAR. More on this later. 2026 Projected fWAR LF RF CF OF Daulton Varsho 2.7 2.7 Nathan Lukes 0.6 0.4 0.2 1.2 Myles Straw - - 0.1 0.1 Jesús Sánchez 1.2 0.2 1.4 Addison Barger 1.0 1.0 Davis Schneider 0.4 0.4 George Springer 0.1 0.6 0.7 Projected 2026 total 2.4 2.3 3.0 7.7 2025 total 2.6 1.9 4.4 8.9 Toronto's Projected Rank - 2026 11 12 12 14 Toronto's Rank - 2025 13 13 4 7 Source: Depth Charts courtesy of FanGraphs The second table shows the career and 2025 OAA and FRV values for the center fielders. Last season, due to injuries (shoulder and hamstring ailments), Varsho accumulated 550 innings in center field for the Blue Jays. That innings number was 38% of Toronto’s center field total (1,438). Defensively, Straw was superb, as evidenced by his 16 OAA/1200 and 16 FRV/1200 scores. Concerning Lukes, his OAA in center field was -1 in 214 innings, but his FRV was zero because his throwing added one run. Hence, Lukes’ overall center field performance was average. Center Field Innings Center Field OAA Per 1200 Center Field FRV Per 1200 Career 2025 Career 2025 Career 2025 Daulton Varsho 2,375 550 16 20 17 13 Nathan Lukes 246 214 -15 -6 -15 0 Myles Straw 4,695 532 9 16 9 16 Source: FanGraphs Regarding Varsho, his decline in arm strength was an issue in 2025. Consider the next table. Please note that the innings shown for each player reflect innings played at all positions (Baseball Savant does not separate the Arm Value numbers by position). However, the Arm Strength numbers shown in the table concern only center field play. After the 2024 campaign, Varsho underwent shoulder surgery and did not play again until April 29, 2025. Upon his return, it was evident that Varsho’s arm strength, which was below average before 2025, was weaker. His Arm Strength was 83.7 mph in 2024, but averaged 73.7 mph in 2025. Among the 44 center fielders with at least 100 throws, Varsho’s 2025 73.7 mph ranked last. In 2024, his arm strength ranked 50th out of 54 center fielders. Outfield Innings Arm Value Per 1200 Fielder Runs Arm Strength (mph) Career 2025 Career 2025 Daulton Varsho 4,330 550 2 -4 -2 73.7 Nathan Lukes 1,150 909 6 5 4 87.0 Myles Straw 4,931 698 0 0 0 82.9 MLB Center Fielder Average 89.6 Source: FanGraphs & Baseball Savant More Good In 2025, Toronto batters had 6,180 plate appearances, 1,680 (26%) of which were against left-handed pitchers. Blue Jays’ center fielders produced a 103 wRC+ (ninth-highest) versus lefties. Overall, Toronto’s center fielders posted a 113 wRC+ (fourth-best), including a 116 wRC+ when facing right-handers (MLB’s 10th best). At the player level, when playing center field, the details are as follows: The standout was Lukes, who posted a 141 wRC+, followed by Varsho (125) and Straw (88). Concerning plate appearances when facing left-handed pitchers, Lukes, Varsho, and Straw had plate appearances totals of 10, 55 and 94, respectively. Their wRC+ scores were 132, 101, and 105, respectively. Regarding wRC+ results against right-handed pitchers, Lukes, Varsho, and Straw generated wRC+ scores of 142, 131 and 88, respectively. They produced their wRC+ numbers in 99, 209 and 123 plate appearances, respectively. For the three center fielders, those 2025 wRC+ numbers are noticeably better than their career splits (when playing all positions). Consider the next table. Career Plate Appearances Career wRC+ LHP RHP Total LHP RHP Overall Daulton Varsho 532 1,855 2,387 90 101 99 Nathan Lukes 72 488 560 83 109 106 Myles Straw 707 1,572 2,279 74 83 80 Source: FanGraphs Let’s look on the bright side. It would be nice if Lukes and Straw replicated their 2025 wRC+ numbers this upcoming season. However, the critical center field bat for the Blue Jays is Varsho. Suppose we are witnessing the emergence of Varsho as an above-average MLB hitter. Before 2025, Varsho generated career wOBA, xwOBA and wRC+ scores of .308, .295 and 96, respectively. In 2025, he produced a .345 wOBA, .327 xwOBA and 123 wRC+. The Depth Charts projected fWAR includes a .315 wOBA for Varsho (in 2025, the MLB average wOBA was .313). Suppose the new Varsho produces a .327 wOBA (his 2025 xwOBA) in 2026; his fWAR estimate rises from 2.7 to 3.2. Furthermore, the Depth Charts' 2.7 fWAR figure includes a 4.5 Def for Varsho. Suppose Varsho plays 1,220 innings in center field in 2026, which corresponds to a 2.0 Positional Adjustment. Accordingly, Varsho’s projected Fielding Runs number is 2.5 (4.5 Def less 2.0 positional adjustment). That Fielding Runs number seems low. In 2025, Varsho’s Fielding Runs figure was 3.9 in 550 innings. In 2024 and 2023, his Fielding Runs were 13.7 and 11.4, respectively. If Varsho’s 2026 Fielding Runs are, for example, 10.0, his projected 2026 fWAR increases from 2.7 to 3.5. Together with the estimated 0.5 fWAR bump from the .327 wOBA, Varsho’s 2026 fWAR would be 4.0 (all other things being equal). Suppose Varsho’s 2026 fWAR is 4.0. Toronto’s estimated total center field fWAR rises from 3.0 to 4.3. A 4.3 fWAR would move the Blue Jays’ center field group back up to the fourth-highest fWAR ranking, which it held in 2025. The Bad The key to Toronto’s 2026 center field success is Varsho. If his arm strength does not return to its 2024 level, Varsho’s defensive production will suffer. Furthermore, if Varsho does not remain a very good MLB hitter this season, as he was in 2025, Toronto’s center field crew will underperform at the plate. The Last Word FanGraphs Depth Charts' 2026 center field projection places Toronto at 12th (3.0 fWAR), which lags the team's fourth-best ranking from 2025. I believe the FGDC estimate is on the low side. If Varsho plays a full season and replicates his 2025 hitting and fielding performance, the Blue Jays should have one of the top center field crews in MLB. Defence, particularly with Varsho and Straw, should be elite. The critical question is whether their bats can excel like they did last season. View full article
.jpg.74a90cbb8c89b6db013e411c86f2864f.jpg)
.jpg.dd96dd3ab511053738391feb0d6060a3.jpg)
.jpg.5114cbe747dff3442088d6a30a951534.jpg)
.jpg.97d64c1b98e7d600951d5ee04f9afe10.jpg)
