


Bob Ritchie
-
Posts
121 -
Joined
-
Last visited
-
Days Won
1
Content Type
Profiles
Toronto Blue Jays Videos
2026 Toronto Blue Jays Top Prospects Ranking
Toronto Blue Jays Free Agent & Trade Rumors, Notes, & Tidbits
Guides & Resources
2025 Toronto Blue Jays Draft Pick Tracker
News
2026 Toronto Blue Jays Draft Tracker: Picks & Bonuses
Forums
Blogs
Events
Store
Downloads
Gallery
Everything posted by Bob Ritchie
-
.jpg.89cd7a04aed2db8fb9fe9e301f2ee3a8.jpg) As the 2025 regular season winds down, media members and others will comment about how Toronto measures up against other 2025 postseason teams. Such analysis is interesting and, for sure, timely. However, I thought it would be thought-provoking to examine Toronto’s 2025 offence at the macro level and see how it measures up against the offences of the teams that have recently played in the World Series. The period I studied spans from 2014 to 2024, except for 2020, which I excluded because the 2020 campaign consisted of only 60 games. The Blue Jays-World Series ballclubs comparison should provide insights into Toronto’s batting and baserunning strengths and weaknesses relative to MLB’s 2025 postseason. The aspects of Toronto’s offence covered are as follows: Key batting metrics (wRC+, runs, home runs, and others) Distribution of runs between home runs and balls in play Hitting performance by pitcher handedness Performance with runners in scoring position Batting order balance Hitting by inning segments Baserunning Speaking of balance, there is a table for each of the bullet points above! Please note that each table contains averages and medians for the indicated period. If the period stated on a table is not 2014-2024, it is because the data did not include seasons before 2016 or 2015. Onto the tables! Table 1 shows key batting metrics for the Blue Jays and the noted World Series participants. The 2023 Diamondbacks are the outlier with their, at best, middle-of-the-pack numbers. Concerning the Blue Jays vis-à-vis wRC+, runs and OBP, the 2025 squad lines up nicely with the teams listed and the average and median rankings for the 2014-2024 period. However, the 2025 Blue Jays trail the non-Arizona teams in home runs and ISO, whether in terms of numbers or rankings. Another way to examine power (ISO) and home runs, particularly, is to look at how teams score runs. That is, how many runs are the result of home runs, and how many runs are attributable to balls in play, balks, and other non-home run plays. For simplicity’s sake, I will lump all runs not arising from home runs to be runs from balls in play (“BIP”). Behold Table 2. As of September 15, 38% of Toronto’s runs have come via home runs and 62% from BIP. In percentage terms, Toronto’s run production due to home runs lags the median by five percentage points and by seven percentage points compared to the average of World Series teams shown (from the 2019 Astros to the 2024 Dodgers). Is Toronto’s relatively low percentage of runs arising from home runs a disadvantage? Yes, because, as FanGraphs’ Jay Jaffe noted in the article, "No-Hitters Are Great, but the Long Ball Still Wins in October", the share of runs due to home runs increases in the postseason compared to the regular season. Let us take a deeper dive. I updated the data in Jaffe’s article for the 2023 and 2024 postseasons. The sources for my numbers were Baseball Savant, FanGraphs and Baseball Reference. The reader should note that my percentage of runs due to home runs (RHR%) is slightly different from Jaffe’s. For the 2015-2022 period, my regular season RHR% is, on average, 1.8 percentage points higher than Jaffe’s. My postseason RHR% is 0.2 percentage points lower than Jaffe’s. These differences are insignificant. It is table chart time! There are three charts: Runs Per Game, Home Runs Per Game, and Percent of Runs Via Home Runs. The chart data support the observations reached by Jaffe, which I also share. The observations are as follows: Compared to the regular season, run scoring per game is lower in the postseason. Scoring runs in the playoffs is more difficult because batters typically face better pitchers in the postseason than in the regular season. Home runs per game have tended to be higher in the postseason compared to the regular season. For the 2015-2024 period, home runs per game were higher in the playoffs in seven of the ten seasons examined. The share of runs attributable to home runs is higher in the postseason than in the regular season. Recent history suggests that the upcoming postseason run scoring will decrease, while home runs per game will remain at least equal, resulting in fewer runs scoring from balls in play. Please note that the runs per home run do not vary much for a given year’s regular and postseason. Accordingly, the conclusion that the share of runs attributable to home runs is higher in the postseason than in the regular season still holds, despite a variance in runs per home run between the regular and postseason. So, what does this mean for Toronto? As of September 21, Toronto leads the American League in runs from BIP (482). Compared to the six non-Toronto American League teams currently in or tied for a playoff spot, the Blue Jays’ 482 mark is much higher than the 403 average BIP runs of the six noted teams. Therefore, Toronto could be more vulnerable to a run-scoring decline because of its relatively high reliance on runs from BIP. Let us get back to the positive news! Consider Tables 3, 4, 5, and 6. The highlights are as follows: Concerning wRC+ by pitcher handedness, Table 3 shows that Toronto is well-balanced versus right-handers (fourth best) and left-handers (third best). Those rankings stack up well against recent World Series teams. Table 4 shows that Toronto’s RISP wRC+ ranks well, be it overall, versus right-handers or left-handers. Furthermore, Toronto’s 2025 RISP wRC+ rankings line up nicely against recent World Series ballclubs. A word of caution. Batting numbers in RISP situations are volatile in small samples. Furthermore, small samples are characteristic of the postseason. Therefore, consider the Table 4 data as descriptive rather than predictive. Many MLB observers have commented upon the high quality of the Blue Jays’ batting order depth, and Table 5 supports that view. In all three batting order segments (#1 to #3, #4 to #6, and #7 to #9), Toronto ranks no worse than eighth among 2025 MLB teams, which compares favourably to the 2015-2024 World Series participants. Regarding wRC+ data by inning segments, Table 6 is the place to see. In the first six innings of the game, Toronto’s 110 wRC+ slots into the seventh spot. Even better, after the sixth inning, the Blue Jays’ 121 wRC+ is MLB’s best. Additionally, Toronto’s noted rankings are in line with those of World Series teams during the 2015-2024 period. Another cautionary note. My interpretation of Toronto’s wRC+ after the sixth inning is not that the Blue Jays are clutch. Instead, Toronto’s excellence in the seventh or later innings demonstrates that the Blue Jays perform well against relievers. Performance after the sixth inning should be a Blue Jays’ strength because relievers share a greater load of the pitching workload in the postseason than in the regular season. The final aspect to examine is baserunning. Table 7 shows that Toronto does not run the bases well, whether stealing bases or taking extra bases in non-stealing situations. For context, Detroit has the highest Baserunning Runs total (8) of the American League teams in contention for a postseason berth. However, baserunning has often not been a strength of several teams that played in the World Series. Hence, Toronto’s baserunning appears to be only a slight disadvantage in the postseason. The Last Word Toronto has had a successful season at the plate in 2025. As of September 17, their wRC+, runs scored, and OBP rank third, fourth and first, respectively, among MLB teams. Furthermore, the Blue Jays have performed well against right-handers and left-handers, be it in RISP or non-RISP situations. Also, Toronto hitters have performed well before the sixth inning and after, and the batting order is deep. Additionally, all these rankings compare favourably with those of recent World Series teams. One area where Toronto does not compare as well is in the power department. Recent history shows that runs via home runs make up a higher percentage of runs scored in the postseason compared to the regular season. Given that run scoring declines in the postseason, teams that are more reliant on runs from BIP can struggle to score. In other words, because pitching in the postseason is better than in the regular season, it is more difficult for teams to string non-homer hits together to score runs. However, Toronto’s home run total and ISO rank as MLB’s 12th highest. Being #12 is not a disaster. It just means that Toronto’s ranking in the power department, which is not as elite as it is in other areas (such as wRC+, OBP, pitcher handedness balance, and other aspects of hitting), may impact Toronto’s run scoring more than teams that are elite in the power department. All things considered, Toronto’s offence compares favourably with teams that have made recent World Series.
As the 2025 regular season winds down, media members and others will comment about how Toronto measures up against other 2025 postseason teams. Such analysis is interesting and, for sure, timely. However, I thought it would be thought-provoking to examine Toronto’s 2025 offence at the macro level and see how it measures up against the offences of the teams that have recently played in the World Series. The period I studied spans from 2014 to 2024, except for 2020, which I excluded because the 2020 campaign consisted of only 60 games. The Blue Jays-World Series ballclubs comparison should provide insights into Toronto’s batting and baserunning strengths and weaknesses relative to MLB’s 2025 postseason. The aspects of Toronto’s offence covered are as follows: Key batting metrics (wRC+, runs, home runs, and others) Distribution of runs between home runs and balls in play Hitting performance by pitcher handedness Performance with runners in scoring position Batting order balance Hitting by inning segments Baserunning Speaking of balance, there is a table for each of the bullet points above! Please note that each table contains averages and medians for the indicated period. If the period stated on a table is not 2014-2024, it is because the data did not include seasons before 2016 or 2015. Onto the tables! Table 1 shows key batting metrics for the Blue Jays and the noted World Series participants. The 2023 Diamondbacks are the outlier with their, at best, middle-of-the-pack numbers. Concerning the Blue Jays vis-à-vis wRC+, runs and OBP, the 2025 squad lines up nicely with the teams listed and the average and median rankings for the 2014-2024 period. However, the 2025 Blue Jays trail the non-Arizona teams in home runs and ISO, whether in terms of numbers or rankings. Another way to examine power (ISO) and home runs, particularly, is to look at how teams score runs. That is, how many runs are the result of home runs, and how many runs are attributable to balls in play, balks, and other non-home run plays. For simplicity’s sake, I will lump all runs not arising from home runs to be runs from balls in play (“BIP”). Behold Table 2. As of September 15, 38% of Toronto’s runs have come via home runs and 62% from BIP. In percentage terms, Toronto’s run production due to home runs lags the median by five percentage points and by seven percentage points compared to the average of World Series teams shown (from the 2019 Astros to the 2024 Dodgers). Is Toronto’s relatively low percentage of runs arising from home runs a disadvantage? Yes, because, as FanGraphs’ Jay Jaffe noted in the article, "No-Hitters Are Great, but the Long Ball Still Wins in October", the share of runs due to home runs increases in the postseason compared to the regular season. Let us take a deeper dive. I updated the data in Jaffe’s article for the 2023 and 2024 postseasons. The sources for my numbers were Baseball Savant, FanGraphs and Baseball Reference. The reader should note that my percentage of runs due to home runs (RHR%) is slightly different from Jaffe’s. For the 2015-2022 period, my regular season RHR% is, on average, 1.8 percentage points higher than Jaffe’s. My postseason RHR% is 0.2 percentage points lower than Jaffe’s. These differences are insignificant. It is table chart time! There are three charts: Runs Per Game, Home Runs Per Game, and Percent of Runs Via Home Runs. The chart data support the observations reached by Jaffe, which I also share. The observations are as follows: Compared to the regular season, run scoring per game is lower in the postseason. Scoring runs in the playoffs is more difficult because batters typically face better pitchers in the postseason than in the regular season. Home runs per game have tended to be higher in the postseason compared to the regular season. For the 2015-2024 period, home runs per game were higher in the playoffs in seven of the ten seasons examined. The share of runs attributable to home runs is higher in the postseason than in the regular season. Recent history suggests that the upcoming postseason run scoring will decrease, while home runs per game will remain at least equal, resulting in fewer runs scoring from balls in play. Please note that the runs per home run do not vary much for a given year’s regular and postseason. Accordingly, the conclusion that the share of runs attributable to home runs is higher in the postseason than in the regular season still holds, despite a variance in runs per home run between the regular and postseason. So, what does this mean for Toronto? As of September 21, Toronto leads the American League in runs from BIP (482). Compared to the six non-Toronto American League teams currently in or tied for a playoff spot, the Blue Jays’ 482 mark is much higher than the 403 average BIP runs of the six noted teams. Therefore, Toronto could be more vulnerable to a run-scoring decline because of its relatively high reliance on runs from BIP. Let us get back to the positive news! Consider Tables 3, 4, 5, and 6. The highlights are as follows: Concerning wRC+ by pitcher handedness, Table 3 shows that Toronto is well-balanced versus right-handers (fourth best) and left-handers (third best). Those rankings stack up well against recent World Series teams. Table 4 shows that Toronto’s RISP wRC+ ranks well, be it overall, versus right-handers or left-handers. Furthermore, Toronto’s 2025 RISP wRC+ rankings line up nicely against recent World Series ballclubs. A word of caution. Batting numbers in RISP situations are volatile in small samples. Furthermore, small samples are characteristic of the postseason. Therefore, consider the Table 4 data as descriptive rather than predictive. Many MLB observers have commented upon the high quality of the Blue Jays’ batting order depth, and Table 5 supports that view. In all three batting order segments (#1 to #3, #4 to #6, and #7 to #9), Toronto ranks no worse than eighth among 2025 MLB teams, which compares favourably to the 2015-2024 World Series participants. Regarding wRC+ data by inning segments, Table 6 is the place to see. In the first six innings of the game, Toronto’s 110 wRC+ slots into the seventh spot. Even better, after the sixth inning, the Blue Jays’ 121 wRC+ is MLB’s best. Additionally, Toronto’s noted rankings are in line with those of World Series teams during the 2015-2024 period. Another cautionary note. My interpretation of Toronto’s wRC+ after the sixth inning is not that the Blue Jays are clutch. Instead, Toronto’s excellence in the seventh or later innings demonstrates that the Blue Jays perform well against relievers. Performance after the sixth inning should be a Blue Jays’ strength because relievers share a greater load of the pitching workload in the postseason than in the regular season. The final aspect to examine is baserunning. Table 7 shows that Toronto does not run the bases well, whether stealing bases or taking extra bases in non-stealing situations. For context, Detroit has the highest Baserunning Runs total (8) of the American League teams in contention for a postseason berth. However, baserunning has often not been a strength of several teams that played in the World Series. Hence, Toronto’s baserunning appears to be only a slight disadvantage in the postseason. The Last Word Toronto has had a successful season at the plate in 2025. As of September 17, their wRC+, runs scored, and OBP rank third, fourth and first, respectively, among MLB teams. Furthermore, the Blue Jays have performed well against right-handers and left-handers, be it in RISP or non-RISP situations. Also, Toronto hitters have performed well before the sixth inning and after, and the batting order is deep. Additionally, all these rankings compare favourably with those of recent World Series teams. One area where Toronto does not compare as well is in the power department. Recent history shows that runs via home runs make up a higher percentage of runs scored in the postseason compared to the regular season. Given that run scoring declines in the postseason, teams that are more reliant on runs from BIP can struggle to score. In other words, because pitching in the postseason is better than in the regular season, it is more difficult for teams to string non-homer hits together to score runs. However, Toronto’s home run total and ISO rank as MLB’s 12th highest. Being #12 is not a disaster. It just means that Toronto’s ranking in the power department, which is not as elite as it is in other areas (such as wRC+, OBP, pitcher handedness balance, and other aspects of hitting), may impact Toronto’s run scoring more than teams that are elite in the power department. All things considered, Toronto’s offence compares favourably with teams that have made recent World Series. -
As of September 10, according to the Fielding Run Value metric (“FRV”), the Toronto Blue Jays have MLB’s best defence with a +40 FRV. However, Toronto’s relative ranking slipped after June. By June 30, Toronto’s defence posted a 36 FRV in 748 innings, 17 FRV units better than the next best team (Atlanta). During the July 1 to September 10 period, Blue Jay defenders recorded a +3 FRV in 539 innings, which is MLB’s 15th-best. Boston and Texas have the best FRV marks after June (+22 FRV). So, why has Toronto’s defence deteriorated after June? Let us dive into the topic. Table 1 is an FRV summary of the pre-July and post-June periods for Toronto and a selection of teams either chasing Toronto for the East Division title (Yankees and Red Sox) or teams recently leading the other American League divisions (Tigers and Astros). The bottom section of the table contains FRV data per 500 innings, which equalizes the time in the field, thereby making comparisons easier. The area of Toronto’s defence that has deteriorated the most is the infield. Before July, Toronto’s infielders generated the fourth-highest FRV (+8 FRV per 500 innings) among MLB teams. However, Blue Jay infielders have produced the second-worst infield defence (-10 FRV per 500 innings). Among Toronto infielders, only Ty France and Andrés Giménez have produced positive FRV numbers after June. However, four players have performed poorly once the calendar turned to July: Addison Barger, Bo Bichette, Ernie Clement, and Vladimir Guerrero Jr. The items to note are as follows: Unfortunately, Baseball Savant does not break down FRV range data (fielder comes in, moves to his right, etc.). Therefore, I used OAA for the analysis. A word of caution: Defensive metrics often fluctuate from one month to another. Barger produced a -4 OAA in July and August (182 innings). When moving to his left, his pre-July OAA was +1; it was -2 after. Defensively, Bichette is a below-average shortstop. From 2021 to 2025, among shortstops with at least 2,700 innings, his -23 FRV ranks 31st of 32 shortstops. Concerning OAA, Bichette posted a -4 by the end of June. In July, he was awful. His -9 OAA was horrible. Concerning his movements to a batted ball, the August OAA details are as follows: in (-4), right (-1), and left (-5). That is balanced fielding! Let’s admit it. Bichette is too slow to play a competent shortstop. In 2021, his Sprint Speed ranked in the 75th percentile; in 2025, his ranking is in the 20th percentile. Bichette's 2025 Sprint Speed ranks 51st among shortstops; he ranked 26th in 2021. His 2025 30ft Running Split is in the 11th percentile; it was 46th in 2021. Bichette is neither fast nor quick. Clement has played very well in the field (+9 FRV for the season). However, he recorded eight of his nine FRV total by the end of May. As a third baseman, he posted a +4 OAA in 220 innings by the end of May, and a +2 OAA in 364 innings after. At second base, Clement recorded a +5 OAA in 139 innings before June, and zero in 183 innings after. Perhaps Clement is a little worn out. As of September 11, his 530 plate appearances exceed his next highest season total (452 in 2024) by 78 (17%). Clement has played more in 2025 than he has in any other MLB season. Clement's notable OAA changes in his detailed range metrics were moving to his right (+5 OAA less after June) and left (+4 OAA less after June). Guerrero Jr. was below-average in July, as evidenced by his -3 OAA. After July, his OAA is zero. For the season, Guerrero Jr.’s -3 OAA ranks 26th among 38 qualified first basemen. Concerning FRV, among first basemen with at least 500 innings, Guerrero Jr. slots in at 17 of 28. Notwithstanding the great throws and crowd-pleasing over-the-head catches of pop-ups, Guerrero is a slightly below-average defender, which he has been since June. Concerning noteworthy OAA range data, Guerrero Jr.'s OAA when moving to his right was +1 before July, and -2 after. What does it all mean? Toronto’s infield defence cratered after June, due largely to Bichette and Clement. For the balance of the season, assuming Barger’s return to form, Bichette’s stay on the Injured List (however long it lasts), Clement’s above-average play at short (+1 OAA in September in 36 innings), Giménez’s superb defence (+7 FRV, tied for MLB’s second-highest score among second-basemen), Guerrero Jr.’s close to average defence, and the additions of France (first base) and Isiah Kiner-Falefa (second or third base), Toronto’s infield defence should be better than it was in the July-August period. Concerning the outfield defence, please take a look at Table 4. My takeaways from the data are as follows: To the extent that John Schneider can limit George Springer’s outfield time, the better. Springer has been below-average in the field this season. Springer’s reduced time in the outfield after June is the main reason Toronto’s outfield’s FRV per 500 increased from +3 to +6. Davis Schneider, Barger, and Nathan Lukes are either slightly above or below average. Among centerfielders with at least 400 innings in centerfield, on a per 500 innings basis, Daulton Varsho and Myles Straw have posted +7 FRV scores, tied for third best. As shown in Table 2, despite an improved FRV/500 after June, Toronto’s outfield defence slipped from fifth best to sixth (per 500 innings), which was still particularly good. For the balance of the season, and assuming Springer’s outfield time is minimal, I expect Toronto’s outfield defence to be a team strength. Onto the catchers! In 2025, Toronto’s catchers have excelled. As depicted in Table 2, Blue Jay catchers ranked first in FRV before July, and third after June. Want some details? Behold Table 5! For the season, Alejandro Kirk has a FRV score of +19, second only to San Francisco’s Patrick Bailey (+27 FRV). Tyler Heineman slides into number eight with his +8 FRV. Kirk’s post-June Catcher Framing and Catcher Blocking scores (per 500 innings) are like his pre-July scores. Heineman’s Catcher Framing prowess declined after June, as evidenced by his pre-July +7 FRV slipping to +3 after June (all FRV numbers are per 500 innings). Both catchers underperformed in the Catcher Throwing Department after June. Let us dig into this area some more. During recent Blue Jays’ broadcasts, commentators have noted that Kirk has not thrown out a baserunner in 20 or so steal attempts. Caught Stealing% (“CS%”) is a terrible statistic because even people who use CS% acknowledge the importance of the pitcher in a team’s attempt to limit an opponent’s running game. Thankfully, Baseball Savant developed the Catcher Throwing metric, which is “based on several inputs at the time the pitch crosses the plate, most notably: runner distance from second, runner speed, pitch location, pitcher/batter handedness, and awareness of pitchouts or delayed steals. It’s the Statcast translation of the long-time saying “you steal off the pitcher, not the catcher.” Concerning pop time, both Kirk and Heineman are better than they were in 2024. Kirk's 2025 Pop Time is 1.94 seconds, better than 2024's 2.00. Heineman's 2025 1.91 Pop Time is a tick quicker than 2024's 1.92. So, why did Toronto catchers underperform (according to Catcher Throwing) after June compared to before July? Unfortunately, Baseball Savant’s Catcher Throwing data does not include monthly breakdowns. In the case of Heineman, the drop from +2 Catcher Throwing to zero could be due to small sample size noise. Concerning Kirk, in addition to the small sample size, the answer may lie within the table below. An examination of the breakdown (right side of the image) reveals that 2025 Kirk has not benefited from teamwork (bounced throws, great tags, and missed slides) as he did in 2024. Perhaps Kirk’s Catcher Throwing before July benefited from teamwork, but not so much after. Notwithstanding Catcher Throwing, I expect Toronto’s elite defence from the catcher position to continue as the 2025 season unfolds. The Last Word For the 2025 season to date, the Blue Jays have a top-tier defence. However, the performance of Toronto’s defenders as a group slipped to middle-of-the-pack during the July 1- September 10 period. Although there were modest performance changes from the outfielder and catcher groups, the defensive weakness after June was the infield. The notable culprits are Bichette, who posted a -8 FRV/500 after June, worse than his pre-July -2 FRV/500, and Clement, who generated a -1 FRV/500 after June and a 7 FRV/500 before. Yet, I expect Toronto’s infield defence to regain its form, not to mention the outfield and catcher units maintaining their performance level, for the balance of the season. View full article
-
Is The Blue Jays’ Defence Slipping Just When It Matters The Most?
Bob Ritchie posted an article in Blue Jays
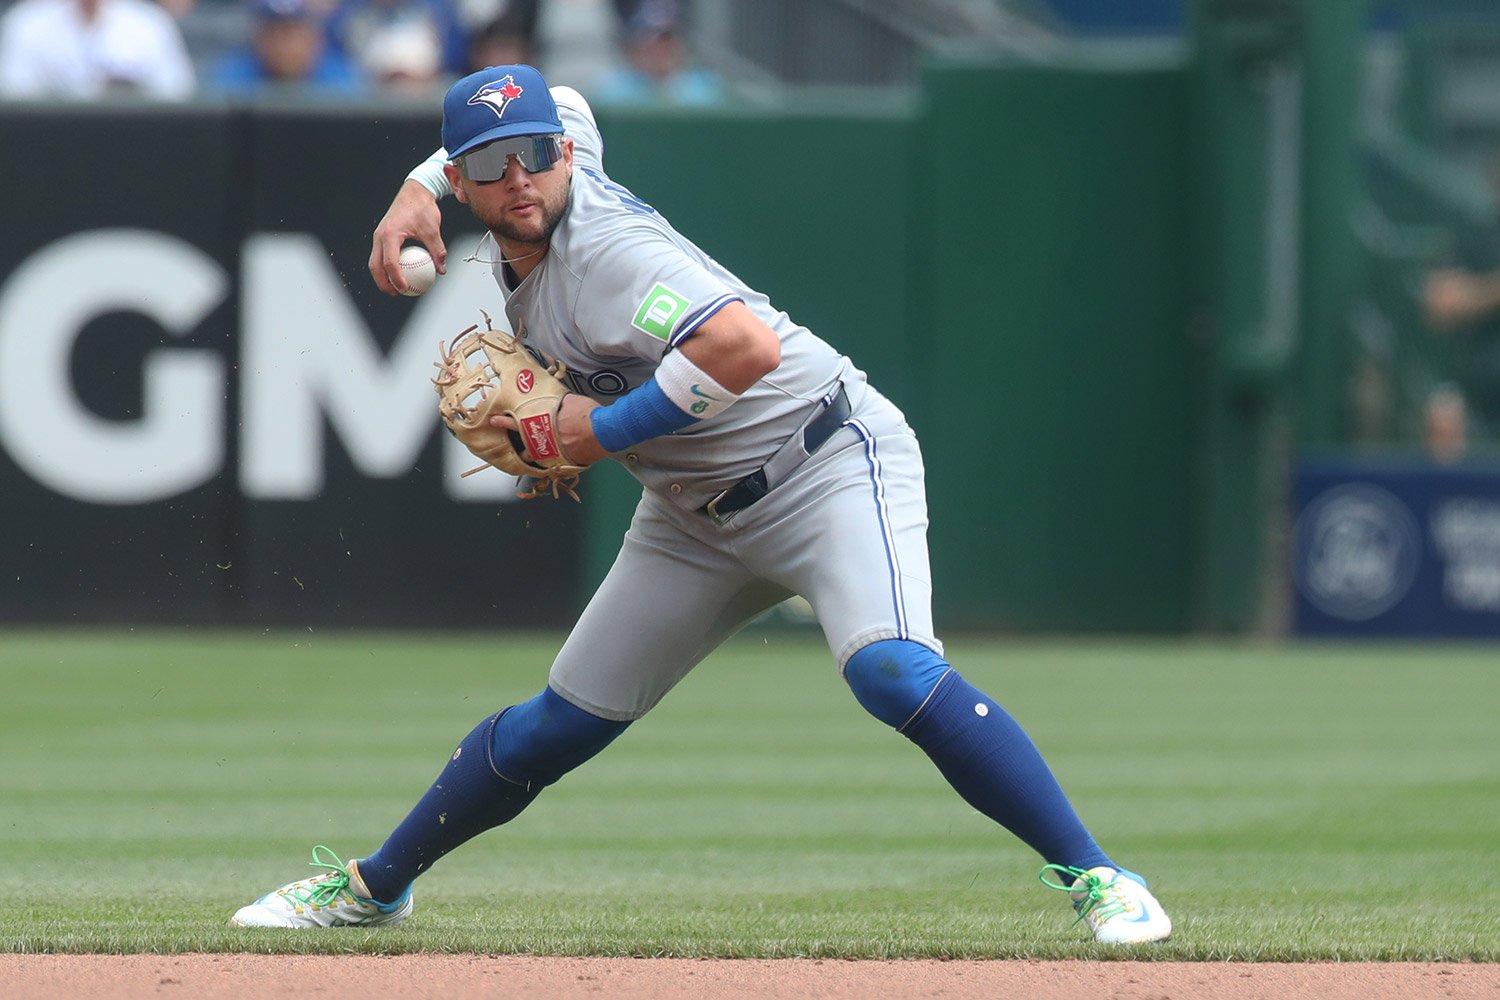 As of September 10, according to the Fielding Run Value metric (“FRV”), the Toronto Blue Jays have MLB’s best defence with a +40 FRV. However, Toronto’s relative ranking slipped after June. By June 30, Toronto’s defence posted a 36 FRV in 748 innings, 17 FRV units better than the next best team (Atlanta). During the July 1 to September 10 period, Blue Jay defenders recorded a +3 FRV in 539 innings, which is MLB’s 15th-best. Boston and Texas have the best FRV marks after June (+22 FRV). So, why has Toronto’s defence deteriorated after June? Let us dive into the topic. Table 1 is an FRV summary of the pre-July and post-June periods for Toronto and a selection of teams either chasing Toronto for the East Division title (Yankees and Red Sox) or teams recently leading the other American League divisions (Tigers and Astros). The bottom section of the table contains FRV data per 500 innings, which equalizes the time in the field, thereby making comparisons easier. The area of Toronto’s defence that has deteriorated the most is the infield. Before July, Toronto’s infielders generated the fourth-highest FRV (+8 FRV per 500 innings) among MLB teams. However, Blue Jay infielders have produced the second-worst infield defence (-10 FRV per 500 innings). Among Toronto infielders, only Ty France and Andrés Giménez have produced positive FRV numbers after June. However, four players have performed poorly once the calendar turned to July: Addison Barger, Bo Bichette, Ernie Clement, and Vladimir Guerrero Jr. The items to note are as follows: Unfortunately, Baseball Savant does not break down FRV range data (fielder comes in, moves to his right, etc.). Therefore, I used OAA for the analysis. A word of caution: Defensive metrics often fluctuate from one month to another. Barger produced a -4 OAA in July and August (182 innings). When moving to his left, his pre-July OAA was +1; it was -2 after. Defensively, Bichette is a below-average shortstop. From 2021 to 2025, among shortstops with at least 2,700 innings, his -23 FRV ranks 31st of 32 shortstops. Concerning OAA, Bichette posted a -4 by the end of June. In July, he was awful. His -9 OAA was horrible. Concerning his movements to a batted ball, the August OAA details are as follows: in (-4), right (-1), and left (-5). That is balanced fielding! Let’s admit it. Bichette is too slow to play a competent shortstop. In 2021, his Sprint Speed ranked in the 75th percentile; in 2025, his ranking is in the 20th percentile. Bichette's 2025 Sprint Speed ranks 51st among shortstops; he ranked 26th in 2021. His 2025 30ft Running Split is in the 11th percentile; it was 46th in 2021. Bichette is neither fast nor quick. Clement has played very well in the field (+9 FRV for the season). However, he recorded eight of his nine FRV total by the end of May. As a third baseman, he posted a +4 OAA in 220 innings by the end of May, and a +2 OAA in 364 innings after. At second base, Clement recorded a +5 OAA in 139 innings before June, and zero in 183 innings after. Perhaps Clement is a little worn out. As of September 11, his 530 plate appearances exceed his next highest season total (452 in 2024) by 78 (17%). Clement has played more in 2025 than he has in any other MLB season. Clement's notable OAA changes in his detailed range metrics were moving to his right (+5 OAA less after June) and left (+4 OAA less after June). Guerrero Jr. was below-average in July, as evidenced by his -3 OAA. After July, his OAA is zero. For the season, Guerrero Jr.’s -3 OAA ranks 26th among 38 qualified first basemen. Concerning FRV, among first basemen with at least 500 innings, Guerrero Jr. slots in at 17 of 28. Notwithstanding the great throws and crowd-pleasing over-the-head catches of pop-ups, Guerrero is a slightly below-average defender, which he has been since June. Concerning noteworthy OAA range data, Guerrero Jr.'s OAA when moving to his right was +1 before July, and -2 after. What does it all mean? Toronto’s infield defence cratered after June, due largely to Bichette and Clement. For the balance of the season, assuming Barger’s return to form, Bichette’s stay on the Injured List (however long it lasts), Clement’s above-average play at short (+1 OAA in September in 36 innings), Giménez’s superb defence (+7 FRV, tied for MLB’s second-highest score among second-basemen), Guerrero Jr.’s close to average defence, and the additions of France (first base) and Isiah Kiner-Falefa (second or third base), Toronto’s infield defence should be better than it was in the July-August period. Concerning the outfield defence, please take a look at Table 4. My takeaways from the data are as follows: To the extent that John Schneider can limit George Springer’s outfield time, the better. Springer has been below-average in the field this season. Springer’s reduced time in the outfield after June is the main reason Toronto’s outfield’s FRV per 500 increased from +3 to +6. Davis Schneider, Barger, and Nathan Lukes are either slightly above or below average. Among centerfielders with at least 400 innings in centerfield, on a per 500 innings basis, Daulton Varsho and Myles Straw have posted +7 FRV scores, tied for third best. As shown in Table 2, despite an improved FRV/500 after June, Toronto’s outfield defence slipped from fifth best to sixth (per 500 innings), which was still particularly good. For the balance of the season, and assuming Springer’s outfield time is minimal, I expect Toronto’s outfield defence to be a team strength. Onto the catchers! In 2025, Toronto’s catchers have excelled. As depicted in Table 2, Blue Jay catchers ranked first in FRV before July, and third after June. Want some details? Behold Table 5! For the season, Alejandro Kirk has a FRV score of +19, second only to San Francisco’s Patrick Bailey (+27 FRV). Tyler Heineman slides into number eight with his +8 FRV. Kirk’s post-June Catcher Framing and Catcher Blocking scores (per 500 innings) are like his pre-July scores. Heineman’s Catcher Framing prowess declined after June, as evidenced by his pre-July +7 FRV slipping to +3 after June (all FRV numbers are per 500 innings). Both catchers underperformed in the Catcher Throwing Department after June. Let us dig into this area some more. During recent Blue Jays’ broadcasts, commentators have noted that Kirk has not thrown out a baserunner in 20 or so steal attempts. Caught Stealing% (“CS%”) is a terrible statistic because even people who use CS% acknowledge the importance of the pitcher in a team’s attempt to limit an opponent’s running game. Thankfully, Baseball Savant developed the Catcher Throwing metric, which is “based on several inputs at the time the pitch crosses the plate, most notably: runner distance from second, runner speed, pitch location, pitcher/batter handedness, and awareness of pitchouts or delayed steals. It’s the Statcast translation of the long-time saying “you steal off the pitcher, not the catcher.” Concerning pop time, both Kirk and Heineman are better than they were in 2024. Kirk's 2025 Pop Time is 1.94 seconds, better than 2024's 2.00. Heineman's 2025 1.91 Pop Time is a tick quicker than 2024's 1.92. So, why did Toronto catchers underperform (according to Catcher Throwing) after June compared to before July? Unfortunately, Baseball Savant’s Catcher Throwing data does not include monthly breakdowns. In the case of Heineman, the drop from +2 Catcher Throwing to zero could be due to small sample size noise. Concerning Kirk, in addition to the small sample size, the answer may lie within the table below. An examination of the breakdown (right side of the image) reveals that 2025 Kirk has not benefited from teamwork (bounced throws, great tags, and missed slides) as he did in 2024. Perhaps Kirk’s Catcher Throwing before July benefited from teamwork, but not so much after. Notwithstanding Catcher Throwing, I expect Toronto’s elite defence from the catcher position to continue as the 2025 season unfolds. The Last Word For the 2025 season to date, the Blue Jays have a top-tier defence. However, the performance of Toronto’s defenders as a group slipped to middle-of-the-pack during the July 1- September 10 period. Although there were modest performance changes from the outfielder and catcher groups, the defensive weakness after June was the infield. The notable culprits are Bichette, who posted a -8 FRV/500 after June, worse than his pre-July -2 FRV/500, and Clement, who generated a -1 FRV/500 after June and a 7 FRV/500 before. Yet, I expect Toronto’s infield defence to regain its form, not to mention the outfield and catcher units maintaining their performance level, for the balance of the season.
 -
After spending the early part of the 2025 MLB season in Buffalo, Addison Barger earned a promotion to the MLB roster in April. Before August, Barger generated an impressive 123 wRC+ and a 0.241 isolated power (ISO) in 324 plate appearances. However, he struggled in August, as evidenced by his lacklustre 60 wRC+ and 0.136 ISO in 96 plate appearances. His August performance raises the obvious question: Is the real Barger the one from before August or the one from after July? Naturally, there is a table in your future. Please take a look at Table 1. Before August, Barger posted striking numbers. His 0.505 SLG exceeded the MLB average by 101 points, and his xwOBA bettered the MLB average by 36 points. It is noteworthy that Barger’s pre-August batting was not fueled by good fortune, as evidenced by the positive xwOBA-wOBA difference. However, August was unkind to Barger. His xwOBA slipped to 0.289, and his SLG was 0.333, both marks below the MLB average. On the positive news front, Barger’s 22.9% strikeout rate (K%) declined from the pre-August 25.3%. What has changed for Barger? Let us dig into the topic by considering the following areas: Plate appearances by count Pitch mix Plate discipline Batted ball direction Contact quality Spoiler alert: The Barger blues should end. Concerning the first four noted areas, please take a look at Table 2. The highlights are as follows: Compared to the pre-August period, the August count distribution was favourable to Barger. There were slight increases in the percentage of plate appearances that found Barger either ahead or even in the count. Notably, Barger’s K% declined from 25.3% to 22.9%, despite more plate appearances that reached two strikes (59% versus 53%). From a pitch mix perspective, there was a slight change in August compared to the pre-August period, but not enough to explain Barger's underperformance. Regarding plate discipline, Barger’s chase rate (Chase Swing%) increased in August to 33.5% from the pre-August 31.9% rate. However, I do not view the 1.6 percentage point increase to be significant, at least not enough to explain the post-July wRC+ and slugging percentage (SLG) declines. Although his chase contact rate (Chase Contact%) declined in August from 56.1% to 51.6%, I do not believe this change was significant because of the small sample size. In August, Barger swung at 64 out-of-zone pitches and made contact 33 times. If he made contact 36 times, his August chase contact rate would have been 56.3%, similar to the March-July period. There was little change in Barger’s batted ball direction numbers in August compared to the pre-August period. Okay, so what explains Barger’s lacklustre August box score numbers? The answer lies in the hard-hit rate (Hard Hit%) and exit velocity numbers. I know, many MLB observers roll their eyes when someone mentions a player’s hard-hit rate. However, in 2025, the average SLG and ISO on hard-hit balls (a batted ball with a minimum exit velocity of 95 mph) are 0.941 and 0.459, respectively. On all other non-bunt batted balls, the average SLG and ISO are 0.247 and 0.034. Hence, hitting a ball hard matters! So, I'd like for you to look at Table 3. Before August, Barger’s overall power numbers were impressive. His xISO and xSLG were 0.242 and 0.522, respectively, both above the relevant MLB average. His hard-hit rate was 55.3%, and his exit velocity (EV) averaged 93.4 mph. However, in August, Barger generated a 37.7% hard-hit rate and an 87.5-mph average EV. Concerning fastballs and offspeed pitches, that EV reduction is significant. How does a batter increase exit velocity? Driveline notes four factors: bat speed, mass of the bat, pitch speed, and hitting the ball on the bat’s sweet spot. My focus is on bat speed and the sweet spot. As it so happens, two of the newer metrics introduced by Baseball Savant are fast-swing rate (bat speed) and squared-up rate (a close approximation of hitting the sweet spot). Back to the topic at hand. Barger’s reduced August exit velocity, and corresponding xISO and xSLG numbers, are consistent with his reduced squared-up rate. Consider Table 4. Barger’s 76-mph average bat speed in August was higher than his pre-August 75.7 mark. For the season, his bat speed ranks in the 93rd percentile. Accordingly, as to why Barger averaged a lower August exit velocity, the issue was not bat speed. It was his squared-up rate. Before August, on all pitches, Barger’s squared-up rate on contact was 33.2%, a little better than the 32.9% MLB average. However, in August, his squared-up rate was 23.3%. In other words, compared to the March-July period, Barger found the bat’s sweet spot at a much lower rate. Given that his bat speed did not decline after July, the reduced squared-up rate would explain the hard-hit rate reduction and the corresponding decline in his power numbers (xISO and xSLG). At the pitch-type level, the reduced squared-up rates in August compared to the pre-August period on fastballs and offspeed pitches are consistent with the respective xISO and xSLG numbers shown in Table 3. Regarding breaking pitches, the pre-August xISO and xSLG numbers are inferior to the respective August numbers, despite August’s tick-lower squared-up rate (31.3% versus 30.8%). This apparent inconsistency (higher power numbers with a lower squared-up rate) may be due partly to launch angles. Barger's average launch angle on breaking pitches in August was 12 degrees, which is in the line drive range. Before August, it was nine degrees, which is in the groundball range. The MLB average xISO and xSLG on line drives are 0.256 and 0.894, respectively. Regarding groundballs, the MLB average xISO and xSLG are 0.028 and 0.279, respectively. In summary, Barger’s August performance slip was consistent with a lower squared-up rate. In other words, compared to the March-April period, Barger found the bat’s sweet spot less frequently in August. One reason he was less successful at hitting pitches on the bat’s sweet spot could be swing mechanics. If that is the cause, one reason for optimism would be a sprinkling of David Popkins’ magic batting dust. If Barger’s slump continues, one change I would make would be to move him out of the lineup’s second spot in the batting order to the sixth spot or lower. Such a move may take pressure off him and reserve the number two slot for a batter who is currently producing better box score numbers. The Last Word Before August, Barger’s 123 wRC+ ranked third among Toronto batters with at least 200 plate appearances. His 0.241 ISO was the best on the team, and his 0.505 SLG trailed only George Springer’s 0.506 mark. The calendar turned to August, and he produced lacklustre box score numbers, including a 60 wRC+. Changes in plate appearances by count, pitch mix, plate discipline, and batted ball direction do not explain Barger’s performance decline. Barger’s poor August performance was consistent with a lower squared-up rate. In other words, Barger was less successful in locating pitches on the bat’s sweet spot than he was during the March-July period. One explanation for that reduced squared-up rate could be a change in swing mechanics, which can improve with time, work and instruction from Toronto’s hitting coaches. This article was written prior to games on September 3. View full article
-
(1).jpg.d181ab8272189c1b51da1698db54f578.jpg) After spending the early part of the 2025 MLB season in Buffalo, Addison Barger earned a promotion to the MLB roster in April. Before August, Barger generated an impressive 123 wRC+ and a 0.241 isolated power (ISO) in 324 plate appearances. However, he struggled in August, as evidenced by his lacklustre 60 wRC+ and 0.136 ISO in 96 plate appearances. His August performance raises the obvious question: Is the real Barger the one from before August or the one from after July? Naturally, there is a table in your future. Please take a look at Table 1. Before August, Barger posted striking numbers. His 0.505 SLG exceeded the MLB average by 101 points, and his xwOBA bettered the MLB average by 36 points. It is noteworthy that Barger’s pre-August batting was not fueled by good fortune, as evidenced by the positive xwOBA-wOBA difference. However, August was unkind to Barger. His xwOBA slipped to 0.289, and his SLG was 0.333, both marks below the MLB average. On the positive news front, Barger’s 22.9% strikeout rate (K%) declined from the pre-August 25.3%. What has changed for Barger? Let us dig into the topic by considering the following areas: Plate appearances by count Pitch mix Plate discipline Batted ball direction Contact quality Spoiler alert: The Barger blues should end. Concerning the first four noted areas, please take a look at Table 2. The highlights are as follows: Compared to the pre-August period, the August count distribution was favourable to Barger. There were slight increases in the percentage of plate appearances that found Barger either ahead or even in the count. Notably, Barger’s K% declined from 25.3% to 22.9%, despite more plate appearances that reached two strikes (59% versus 53%). From a pitch mix perspective, there was a slight change in August compared to the pre-August period, but not enough to explain Barger's underperformance. Regarding plate discipline, Barger’s chase rate (Chase Swing%) increased in August to 33.5% from the pre-August 31.9% rate. However, I do not view the 1.6 percentage point increase to be significant, at least not enough to explain the post-July wRC+ and slugging percentage (SLG) declines. Although his chase contact rate (Chase Contact%) declined in August from 56.1% to 51.6%, I do not believe this change was significant because of the small sample size. In August, Barger swung at 64 out-of-zone pitches and made contact 33 times. If he made contact 36 times, his August chase contact rate would have been 56.3%, similar to the March-July period. There was little change in Barger’s batted ball direction numbers in August compared to the pre-August period. Okay, so what explains Barger’s lacklustre August box score numbers? The answer lies in the hard-hit rate (Hard Hit%) and exit velocity numbers. I know, many MLB observers roll their eyes when someone mentions a player’s hard-hit rate. However, in 2025, the average SLG and ISO on hard-hit balls (a batted ball with a minimum exit velocity of 95 mph) are 0.941 and 0.459, respectively. On all other non-bunt batted balls, the average SLG and ISO are 0.247 and 0.034. Hence, hitting a ball hard matters! So, I'd like for you to look at Table 3. Before August, Barger’s overall power numbers were impressive. His xISO and xSLG were 0.242 and 0.522, respectively, both above the relevant MLB average. His hard-hit rate was 55.3%, and his exit velocity (EV) averaged 93.4 mph. However, in August, Barger generated a 37.7% hard-hit rate and an 87.5-mph average EV. Concerning fastballs and offspeed pitches, that EV reduction is significant. How does a batter increase exit velocity? Driveline notes four factors: bat speed, mass of the bat, pitch speed, and hitting the ball on the bat’s sweet spot. My focus is on bat speed and the sweet spot. As it so happens, two of the newer metrics introduced by Baseball Savant are fast-swing rate (bat speed) and squared-up rate (a close approximation of hitting the sweet spot). Back to the topic at hand. Barger’s reduced August exit velocity, and corresponding xISO and xSLG numbers, are consistent with his reduced squared-up rate. Consider Table 4. Barger’s 76-mph average bat speed in August was higher than his pre-August 75.7 mark. For the season, his bat speed ranks in the 93rd percentile. Accordingly, as to why Barger averaged a lower August exit velocity, the issue was not bat speed. It was his squared-up rate. Before August, on all pitches, Barger’s squared-up rate on contact was 33.2%, a little better than the 32.9% MLB average. However, in August, his squared-up rate was 23.3%. In other words, compared to the March-July period, Barger found the bat’s sweet spot at a much lower rate. Given that his bat speed did not decline after July, the reduced squared-up rate would explain the hard-hit rate reduction and the corresponding decline in his power numbers (xISO and xSLG). At the pitch-type level, the reduced squared-up rates in August compared to the pre-August period on fastballs and offspeed pitches are consistent with the respective xISO and xSLG numbers shown in Table 3. Regarding breaking pitches, the pre-August xISO and xSLG numbers are inferior to the respective August numbers, despite August’s tick-lower squared-up rate (31.3% versus 30.8%). This apparent inconsistency (higher power numbers with a lower squared-up rate) may be due partly to launch angles. Barger's average launch angle on breaking pitches in August was 12 degrees, which is in the line drive range. Before August, it was nine degrees, which is in the groundball range. The MLB average xISO and xSLG on line drives are 0.256 and 0.894, respectively. Regarding groundballs, the MLB average xISO and xSLG are 0.028 and 0.279, respectively. In summary, Barger’s August performance slip was consistent with a lower squared-up rate. In other words, compared to the March-April period, Barger found the bat’s sweet spot less frequently in August. One reason he was less successful at hitting pitches on the bat’s sweet spot could be swing mechanics. If that is the cause, one reason for optimism would be a sprinkling of David Popkins’ magic batting dust. If Barger’s slump continues, one change I would make would be to move him out of the lineup’s second spot in the batting order to the sixth spot or lower. Such a move may take pressure off him and reserve the number two slot for a batter who is currently producing better box score numbers. The Last Word Before August, Barger’s 123 wRC+ ranked third among Toronto batters with at least 200 plate appearances. His 0.241 ISO was the best on the team, and his 0.505 SLG trailed only George Springer’s 0.506 mark. The calendar turned to August, and he produced lacklustre box score numbers, including a 60 wRC+. Changes in plate appearances by count, pitch mix, plate discipline, and batted ball direction do not explain Barger’s performance decline. Barger’s poor August performance was consistent with a lower squared-up rate. In other words, Barger was less successful in locating pitches on the bat’s sweet spot than he was during the March-July period. One explanation for that reduced squared-up rate could be a change in swing mechanics, which can improve with time, work and instruction from Toronto’s hitting coaches. This article was written prior to games on September 3.
After spending the early part of the 2025 MLB season in Buffalo, Addison Barger earned a promotion to the MLB roster in April. Before August, Barger generated an impressive 123 wRC+ and a 0.241 isolated power (ISO) in 324 plate appearances. However, he struggled in August, as evidenced by his lacklustre 60 wRC+ and 0.136 ISO in 96 plate appearances. His August performance raises the obvious question: Is the real Barger the one from before August or the one from after July? Naturally, there is a table in your future. Please take a look at Table 1. Before August, Barger posted striking numbers. His 0.505 SLG exceeded the MLB average by 101 points, and his xwOBA bettered the MLB average by 36 points. It is noteworthy that Barger’s pre-August batting was not fueled by good fortune, as evidenced by the positive xwOBA-wOBA difference. However, August was unkind to Barger. His xwOBA slipped to 0.289, and his SLG was 0.333, both marks below the MLB average. On the positive news front, Barger’s 22.9% strikeout rate (K%) declined from the pre-August 25.3%. What has changed for Barger? Let us dig into the topic by considering the following areas: Plate appearances by count Pitch mix Plate discipline Batted ball direction Contact quality Spoiler alert: The Barger blues should end. Concerning the first four noted areas, please take a look at Table 2. The highlights are as follows: Compared to the pre-August period, the August count distribution was favourable to Barger. There were slight increases in the percentage of plate appearances that found Barger either ahead or even in the count. Notably, Barger’s K% declined from 25.3% to 22.9%, despite more plate appearances that reached two strikes (59% versus 53%). From a pitch mix perspective, there was a slight change in August compared to the pre-August period, but not enough to explain Barger's underperformance. Regarding plate discipline, Barger’s chase rate (Chase Swing%) increased in August to 33.5% from the pre-August 31.9% rate. However, I do not view the 1.6 percentage point increase to be significant, at least not enough to explain the post-July wRC+ and slugging percentage (SLG) declines. Although his chase contact rate (Chase Contact%) declined in August from 56.1% to 51.6%, I do not believe this change was significant because of the small sample size. In August, Barger swung at 64 out-of-zone pitches and made contact 33 times. If he made contact 36 times, his August chase contact rate would have been 56.3%, similar to the March-July period. There was little change in Barger’s batted ball direction numbers in August compared to the pre-August period. Okay, so what explains Barger’s lacklustre August box score numbers? The answer lies in the hard-hit rate (Hard Hit%) and exit velocity numbers. I know, many MLB observers roll their eyes when someone mentions a player’s hard-hit rate. However, in 2025, the average SLG and ISO on hard-hit balls (a batted ball with a minimum exit velocity of 95 mph) are 0.941 and 0.459, respectively. On all other non-bunt batted balls, the average SLG and ISO are 0.247 and 0.034. Hence, hitting a ball hard matters! So, I'd like for you to look at Table 3. Before August, Barger’s overall power numbers were impressive. His xISO and xSLG were 0.242 and 0.522, respectively, both above the relevant MLB average. His hard-hit rate was 55.3%, and his exit velocity (EV) averaged 93.4 mph. However, in August, Barger generated a 37.7% hard-hit rate and an 87.5-mph average EV. Concerning fastballs and offspeed pitches, that EV reduction is significant. How does a batter increase exit velocity? Driveline notes four factors: bat speed, mass of the bat, pitch speed, and hitting the ball on the bat’s sweet spot. My focus is on bat speed and the sweet spot. As it so happens, two of the newer metrics introduced by Baseball Savant are fast-swing rate (bat speed) and squared-up rate (a close approximation of hitting the sweet spot). Back to the topic at hand. Barger’s reduced August exit velocity, and corresponding xISO and xSLG numbers, are consistent with his reduced squared-up rate. Consider Table 4. Barger’s 76-mph average bat speed in August was higher than his pre-August 75.7 mark. For the season, his bat speed ranks in the 93rd percentile. Accordingly, as to why Barger averaged a lower August exit velocity, the issue was not bat speed. It was his squared-up rate. Before August, on all pitches, Barger’s squared-up rate on contact was 33.2%, a little better than the 32.9% MLB average. However, in August, his squared-up rate was 23.3%. In other words, compared to the March-July period, Barger found the bat’s sweet spot at a much lower rate. Given that his bat speed did not decline after July, the reduced squared-up rate would explain the hard-hit rate reduction and the corresponding decline in his power numbers (xISO and xSLG). At the pitch-type level, the reduced squared-up rates in August compared to the pre-August period on fastballs and offspeed pitches are consistent with the respective xISO and xSLG numbers shown in Table 3. Regarding breaking pitches, the pre-August xISO and xSLG numbers are inferior to the respective August numbers, despite August’s tick-lower squared-up rate (31.3% versus 30.8%). This apparent inconsistency (higher power numbers with a lower squared-up rate) may be due partly to launch angles. Barger's average launch angle on breaking pitches in August was 12 degrees, which is in the line drive range. Before August, it was nine degrees, which is in the groundball range. The MLB average xISO and xSLG on line drives are 0.256 and 0.894, respectively. Regarding groundballs, the MLB average xISO and xSLG are 0.028 and 0.279, respectively. In summary, Barger’s August performance slip was consistent with a lower squared-up rate. In other words, compared to the March-April period, Barger found the bat’s sweet spot less frequently in August. One reason he was less successful at hitting pitches on the bat’s sweet spot could be swing mechanics. If that is the cause, one reason for optimism would be a sprinkling of David Popkins’ magic batting dust. If Barger’s slump continues, one change I would make would be to move him out of the lineup’s second spot in the batting order to the sixth spot or lower. Such a move may take pressure off him and reserve the number two slot for a batter who is currently producing better box score numbers. The Last Word Before August, Barger’s 123 wRC+ ranked third among Toronto batters with at least 200 plate appearances. His 0.241 ISO was the best on the team, and his 0.505 SLG trailed only George Springer’s 0.506 mark. The calendar turned to August, and he produced lacklustre box score numbers, including a 60 wRC+. Changes in plate appearances by count, pitch mix, plate discipline, and batted ball direction do not explain Barger’s performance decline. Barger’s poor August performance was consistent with a lower squared-up rate. In other words, Barger was less successful in locating pitches on the bat’s sweet spot than he was during the March-July period. One explanation for that reduced squared-up rate could be a change in swing mechanics, which can improve with time, work and instruction from Toronto’s hitting coaches. This article was written prior to games on September 3. -
Should There Be Concern With The Recent Results Of José Berrios?
Bob Ritchie posted an article in Blue Jays
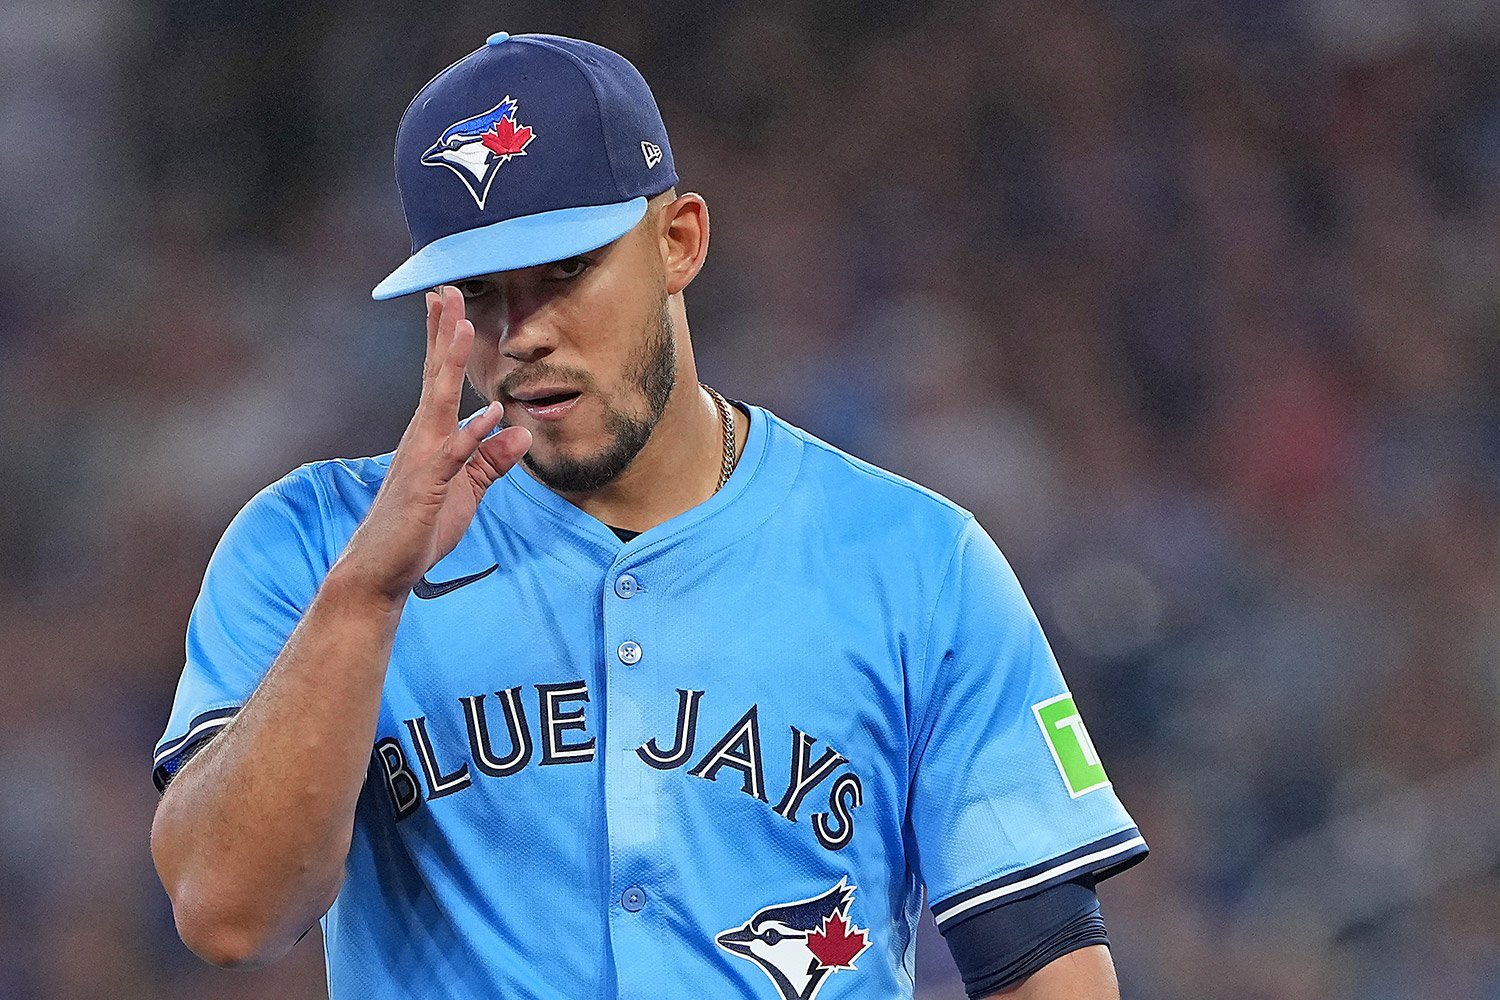 Since 2018, Jose Berrios has been one of MLB’s most reliable and consistent starting pitchers. Except for the pandemic-shortened 2020 season, he has posted 32 starts in each campaign between 2018 and 2024, and this season, Berrios is on pace for, yep, 32 starts. In the 2018-2024 period, the fewest number of innings pitched by Berrios in a 162-game season was 2022’s 172. Concerning ERA, except for the noted 2020 campaign (56th percentile) and the awful 2022 (13th percentile), Berrios’ ERA percentile ranking has ranged between 64th and 79th, which is the ERA slot range for a number two starter. Hence, Berrios has been a consistent starter over the years. What is happening this season? Overall, Berrios’ 2025 performance has slipped. The season began well: In his first 17 outings, he recorded a 3.26 ERA and a 1.06 HR/9 in 102 innings (six innings per start). In his nine most recent starts (from July 2 to August 17), Berrios has posted a 5.68 ERA and 5.62 FIP in 44 1/3 innings (4.92 innings per start). His 2.03 HR/9 in this period is markedly higher than the 1.24 MLB average for a starter. For the season, his 4.00 ERA ranks in the 51st percentile among starters with at least 50 innings. Mad Men’s Pete Campbell best summarized Berrios’ 2025 season to date. Is Berrios’ 2025 campaign a tale of two parts? The first 17 starts and the next nine? Does fatigue explain much of the post-June underperformance, or are there some underlying issues that have persisted throughout the 2025 season? Let us dig into the topic. Table 1 shows that the 2025 Berrios version is a slightly below-average starter. Except for ERA, all the 2025 numbers are worse than the MLB average for a starter. It is noteworthy that Berrios’ 2024 struggles versus right-handed hitters continue this season. His 2025 .339 wOBA is higher than both 2024’s .311 and his .297 career mark. Those elevated wOBA figures are due in part to higher home run rates compared to his pre-2024 career. For the 2016-2023 period, Berrios surrendered a home run to right-handed batters once every 35.3 at-bats. In 2024 and 2025, the comparable rates are once every 26.2 at-bats and 17.5 at-bats, respectively. The MLB average AB/HR is 29.4. Hence, based on the two most recent seasons, Berrios’ mastery over right-handed hitters is no longer. Are there signs of in-season fatigue? If fatigue was a major contributor to Berrios’s recent underperformance, we should see a steady rise in the monthly xwOBA numbers. Why? Because fatigue could cause batters to make better and more frequent contact on Berrios’ pitches. xwOBA, more so than wOBA, can capture a change in batted ball characteristics. Table 2 shows that for a given pitch, the monthly xwOBA figure bounces around quite a bit. The xwOBA on his sinker was elevated in June and August, but July’s was like the first two months of the season. Berrios’ slurve’s monthly xwOBA has followed the better-than-average then worse-than-average cycle since the beginning of the 2025 campaign. The xwOBA on his four-seam fastball has exceeded the MLB average every month. The xwOBA data does not show a consistent monthly increase. Fatigue does not explain why Berrios has been below average this season, nor his poor post-June metrics. Are there other reasons that might explain Berrios’ decline? Is there a table with answers? Yes, Table 3! Compared to 2024, as highlighted in Table 3, Berrios’ sinker, four-seam fastball, and cutter have lost velocity. His 2025 sinker has averaged 92.1 mph, 1.3 mph slower than 2024. From May onwards, the sinker’s average monthly velocity has been at least 1.1 mph slower than the 2024 offering. A 1.1 mph velocity decline from the previous season is significant. Furthermore, the average velocity of the four-seam fastball and the cutter is at least 1.2 mph slower than the 2024 comparable pitch types. That is also a considerable reduction in velocity. Notably, Berrios’ pitches have had meagre spin rate changes (less than 3%). One reason Berrios has not pitched as well as he has in the past is the sizeable decline in pitch velocity. Let us take a closer look. FanGraphs’ website includes Pitching+, Stuff+, and Location+ data. For an explanation of these three models, please refer to this. Table 4 shows the noted Berrios data for the past five seasons. The highlights are as follows: Stuff+, which includes velocity and other pitch characteristics, shows the erosion of Berrios’ stuff since 2021. In 2021, his sinker’s Stuff+ was 110. For context, Jacob deGrom’s 2025 sinker has a 110 Stuff+ score. That is a good sinker. However, the Stuff+ score for Berrios’s sinker has steadily declined, and his 2025 Stuff+ grade is 89. The Stuff+ scores on all his pitches have declined since the 2021 campaign. Overall, his 2025 Stuff+ score is 89, which is below average. One consistent Berrios attribute is that he locates his pitches well. His 102 Location+ score is better than average. All his 2025 pitches are either a tick below average (99) or are better than average. Notably, the Berrios changeup’s 112 Location+ score surpasses the 111 posted this season by some fella named Paul Skenes. Back to the negative. Pitching+, which FanGraphs’ Owen McGrattan described as an assessment of “the overall quality of the pitcher’s process,” does not show Berrios in a good light. Each of Berrios’ pitches is below average according to their respective Pitching+ scores. Overall, Berrios’ 93 grade is sub-par. Furthermore, since 2021, the collective quality of Berrios’ offerings has deteriorated. Okay, the quality of Berrios' 2025 pitches is below average. Yet, how does one explain the first 17 starts that generated a 3.26 ERA, and the next nine outings yielded a 5.68 ERA? There are two answers: defence and regression. High-quality defence should suppress a pitcher’s ERA. Before July 1, Toronto provided excellent defence behind Berrios, as evidenced by the nine Fielding Run Value (“FRV”) score. However, after June 30, Toronto’s defence was below average when Berrios was on the mound (-3 FRV), which would put upward pressure on a pitcher’s ERA. Please note that Baseball Savant does not provide FRV pitcher-specific data by batter handedness. The second explanation of Berrios’ poor box score results after June is regression. Put another way, Lady Luck looked favourably upon Berrios before July but has since cast an unfavourable eye upon him. Berrios’ pre-July xwOBA numbers are remarkably like the post-June scores. However, the xwOBA-wOBA deltas are pretty different. For example, before July, Berrios’ overall .343 xwOBA exceeded his .303 wOBA by 40 points. However, after June, his .344 xwOBA was surpassed by the .373 wOBA. That is a 69-point swing, which is significant. A similar pattern exists concerning the pre-July and post-June splits by batter handedness. Therefore, because the pre-July and post-June expected results are similar, Berrios is pitching the same throughout 2025. What changed after June are the box-score results (ERA, wOBA, etc.), partly due to regression/luck. Indeed, other factors may have contributed to Berrios’ post-June underperformance. However, the deterioration of defensive support and regression are among the factors. What does all of this mean for the balance of the 2025 regular season and postseason? Berrios’ underlying metrics (xwOBA, Pitching+, and others) are not easily improved in-season. Unless Lady Luck switches course or Berrios takes pitch sequencing to another level, Berrios is likely to perform at a below-average level for the rest of 2025. If one defines a number three starter as average, then Berrios projects to be a number three or four starter for the balance of this season. Furthermore, based on 2025 performance, Berrios is a probable candidate to be removed by John Schneider from the postseason starting rotation. The Last Word Concerning the number of starts, innings, and ERA-percentile rankings, Berrios has been a remarkably consistent pitcher during his career. However, Berrios has struggled this season. His stuff has deteriorated from previous levels, and his underlying metrics (xERA, FIP, and others) are below-average. Furthermore, the underlying metrics were below average before his recent (post-June) box-score struggles. Berrios’ pre-July 3.26 ERA has risen to 4.00 (as of August 17), not because of fatigue but due to below-average defensive support and regression/reversal of good luck. In summary, if one expects second starter performance from Berrios during the balance of 2025, there are reasons to be concerned.
 -
Since 2018, Jose Berrios has been one of MLB’s most reliable and consistent starting pitchers. Except for the pandemic-shortened 2020 season, he has posted 32 starts in each campaign between 2018 and 2024, and this season, Berrios is on pace for, yep, 32 starts. In the 2018-2024 period, the fewest number of innings pitched by Berrios in a 162-game season was 2022’s 172. Concerning ERA, except for the noted 2020 campaign (56th percentile) and the awful 2022 (13th percentile), Berrios’ ERA percentile ranking has ranged between 64th and 79th, which is the ERA slot range for a number two starter. Hence, Berrios has been a consistent starter over the years. What is happening this season? Overall, Berrios’ 2025 performance has slipped. The season began well: In his first 17 outings, he recorded a 3.26 ERA and a 1.06 HR/9 in 102 innings (six innings per start). In his nine most recent starts (from July 2 to August 17), Berrios has posted a 5.68 ERA and 5.62 FIP in 44 1/3 innings (4.92 innings per start). His 2.03 HR/9 in this period is markedly higher than the 1.24 MLB average for a starter. For the season, his 4.00 ERA ranks in the 51st percentile among starters with at least 50 innings. Mad Men’s Pete Campbell best summarized Berrios’ 2025 season to date. Is Berrios’ 2025 campaign a tale of two parts? The first 17 starts and the next nine? Does fatigue explain much of the post-June underperformance, or are there some underlying issues that have persisted throughout the 2025 season? Let us dig into the topic. Table 1 shows that the 2025 Berrios version is a slightly below-average starter. Except for ERA, all the 2025 numbers are worse than the MLB average for a starter. It is noteworthy that Berrios’ 2024 struggles versus right-handed hitters continue this season. His 2025 .339 wOBA is higher than both 2024’s .311 and his .297 career mark. Those elevated wOBA figures are due in part to higher home run rates compared to his pre-2024 career. For the 2016-2023 period, Berrios surrendered a home run to right-handed batters once every 35.3 at-bats. In 2024 and 2025, the comparable rates are once every 26.2 at-bats and 17.5 at-bats, respectively. The MLB average AB/HR is 29.4. Hence, based on the two most recent seasons, Berrios’ mastery over right-handed hitters is no longer. Are there signs of in-season fatigue? If fatigue was a major contributor to Berrios’s recent underperformance, we should see a steady rise in the monthly xwOBA numbers. Why? Because fatigue could cause batters to make better and more frequent contact on Berrios’ pitches. xwOBA, more so than wOBA, can capture a change in batted ball characteristics. Table 2 shows that for a given pitch, the monthly xwOBA figure bounces around quite a bit. The xwOBA on his sinker was elevated in June and August, but July’s was like the first two months of the season. Berrios’ slurve’s monthly xwOBA has followed the better-than-average then worse-than-average cycle since the beginning of the 2025 campaign. The xwOBA on his four-seam fastball has exceeded the MLB average every month. The xwOBA data does not show a consistent monthly increase. Fatigue does not explain why Berrios has been below average this season, nor his poor post-June metrics. Are there other reasons that might explain Berrios’ decline? Is there a table with answers? Yes, Table 3! Compared to 2024, as highlighted in Table 3, Berrios’ sinker, four-seam fastball, and cutter have lost velocity. His 2025 sinker has averaged 92.1 mph, 1.3 mph slower than 2024. From May onwards, the sinker’s average monthly velocity has been at least 1.1 mph slower than the 2024 offering. A 1.1 mph velocity decline from the previous season is significant. Furthermore, the average velocity of the four-seam fastball and the cutter is at least 1.2 mph slower than the 2024 comparable pitch types. That is also a considerable reduction in velocity. Notably, Berrios’ pitches have had meagre spin rate changes (less than 3%). One reason Berrios has not pitched as well as he has in the past is the sizeable decline in pitch velocity. Let us take a closer look. FanGraphs’ website includes Pitching+, Stuff+, and Location+ data. For an explanation of these three models, please refer to this. Table 4 shows the noted Berrios data for the past five seasons. The highlights are as follows: Stuff+, which includes velocity and other pitch characteristics, shows the erosion of Berrios’ stuff since 2021. In 2021, his sinker’s Stuff+ was 110. For context, Jacob deGrom’s 2025 sinker has a 110 Stuff+ score. That is a good sinker. However, the Stuff+ score for Berrios’s sinker has steadily declined, and his 2025 Stuff+ grade is 89. The Stuff+ scores on all his pitches have declined since the 2021 campaign. Overall, his 2025 Stuff+ score is 89, which is below average. One consistent Berrios attribute is that he locates his pitches well. His 102 Location+ score is better than average. All his 2025 pitches are either a tick below average (99) or are better than average. Notably, the Berrios changeup’s 112 Location+ score surpasses the 111 posted this season by some fella named Paul Skenes. Back to the negative. Pitching+, which FanGraphs’ Owen McGrattan described as an assessment of “the overall quality of the pitcher’s process,” does not show Berrios in a good light. Each of Berrios’ pitches is below average according to their respective Pitching+ scores. Overall, Berrios’ 93 grade is sub-par. Furthermore, since 2021, the collective quality of Berrios’ offerings has deteriorated. Okay, the quality of Berrios' 2025 pitches is below average. Yet, how does one explain the first 17 starts that generated a 3.26 ERA, and the next nine outings yielded a 5.68 ERA? There are two answers: defence and regression. High-quality defence should suppress a pitcher’s ERA. Before July 1, Toronto provided excellent defence behind Berrios, as evidenced by the nine Fielding Run Value (“FRV”) score. However, after June 30, Toronto’s defence was below average when Berrios was on the mound (-3 FRV), which would put upward pressure on a pitcher’s ERA. Please note that Baseball Savant does not provide FRV pitcher-specific data by batter handedness. The second explanation of Berrios’ poor box score results after June is regression. Put another way, Lady Luck looked favourably upon Berrios before July but has since cast an unfavourable eye upon him. Berrios’ pre-July xwOBA numbers are remarkably like the post-June scores. However, the xwOBA-wOBA deltas are pretty different. For example, before July, Berrios’ overall .343 xwOBA exceeded his .303 wOBA by 40 points. However, after June, his .344 xwOBA was surpassed by the .373 wOBA. That is a 69-point swing, which is significant. A similar pattern exists concerning the pre-July and post-June splits by batter handedness. Therefore, because the pre-July and post-June expected results are similar, Berrios is pitching the same throughout 2025. What changed after June are the box-score results (ERA, wOBA, etc.), partly due to regression/luck. Indeed, other factors may have contributed to Berrios’ post-June underperformance. However, the deterioration of defensive support and regression are among the factors. What does all of this mean for the balance of the 2025 regular season and postseason? Berrios’ underlying metrics (xwOBA, Pitching+, and others) are not easily improved in-season. Unless Lady Luck switches course or Berrios takes pitch sequencing to another level, Berrios is likely to perform at a below-average level for the rest of 2025. If one defines a number three starter as average, then Berrios projects to be a number three or four starter for the balance of this season. Furthermore, based on 2025 performance, Berrios is a probable candidate to be removed by John Schneider from the postseason starting rotation. The Last Word Concerning the number of starts, innings, and ERA-percentile rankings, Berrios has been a remarkably consistent pitcher during his career. However, Berrios has struggled this season. His stuff has deteriorated from previous levels, and his underlying metrics (xERA, FIP, and others) are below-average. Furthermore, the underlying metrics were below average before his recent (post-June) box-score struggles. Berrios’ pre-July 3.26 ERA has risen to 4.00 (as of August 17), not because of fatigue but due to below-average defensive support and regression/reversal of good luck. In summary, if one expects second starter performance from Berrios during the balance of 2025, there are reasons to be concerned. View full article
-
Article: Hey Blue Jays, What’s With All The Bunting?
Bob Ritchie replied to Owen Hill's topic in Jays Centre Front Page News
😉- 2 replies
-
- 1
-

-
- ernie clement
- myles straw
- (and 2 more)
-
Do the Blue Jays Use Little Too Much or Little Too Little?
Bob Ritchie posted an article in Blue Jays
 A frequent conversation among armchair field managers is whether John Schneider uses some relievers more than he should, to the point that those bullpen arms underperform due to fatigue. Two of the names that appear the most in those discussions are Jeff Hoffman and Brendon Little. Has Schneider used these two relievers excessively? How does the Blue Jays' bullpen usage compare to the Houston Astros, one of the better American League bullpens? Let’s find some tables! My bullpen usage examination will consider two aspects of reliever management: the average number of days between appearances and the average number of outings per month. I selected Houston's bullpen as the comparison because it leads the American League in xERA and WPA. Table 1 is the first chart on the agenda. The data presented is the five current Toronto relievers with the most innings pitched as a Blue Jay in 2025. Please note that I excluded Chad Green, who Toronto designated for assignment on July 29 and released on August 3, who ranks fifth in innings pitched among Blue Jay relievers. The Houston average is for its five relievers with the most innings. I also present the numbers for Josh Hader, Houston’s closer, and Bryan Abreu, the Astro with the most holds (25). These two relievers are comparable to Hoffman (Toronto’s closer) and Little, who leads Toronto with 24 holds. The average number of days between outings for Toronto and Houston is similar. The exception is Toronto’s listed relievers have averaged 18 outings on one day’s rest, whereas Houston’s bullpen arms have averaged 14. Regarding the closers, Hoffman has 15 appearances on zero days’ rest, five more than Hader. On less than two days’ rest, Hoffman has 31 outings, six more than Hader. It is noteworthy that Hader is on the 15-day Injured List with a shoulder strain, and reporters expect him to be on the sidelines beyond the 15 days. He has not pitched since August 8. After August 8, Hoffman has appeared four times: one on six days' rest, two on one day's rest, and one on zero days off. Therefore, before August 9, Hoffman had 49 outings, and 28 on less than two days' rest. Thus, according to Table 1, there is not much difference in usage between Hoffman and Hader. Regarding Little and Abreu, Little has 26 outings on one day of rest, higher than Abreu’s 16. Yet, Little’s 34 outings with less than two days’ rest are not significantly more than those of Abreu’s 30. With days of rest less than four days but more than one, Abreu’s 19 appearances are equal to Little’s 19. In other words, Little’s workload in terms of rest days is not dissimilar from Abreu’s. One aspect of Hoffman’s usage is that he has, on five occasions, pitched four times in five days. In 2025, Hader has not pitched four times in five days. Except for Boston’s Aroldis Chapman, I did not examine other American League closers concerning four appearances over five days. Chapman has pitched four times in five days on two occasions. Hence, Hoffman’s concentrated usage over five days is unusual. However, I would be reluctant to criticize Schneider for Hoffman’s usage in the noted five-day stretches. The fourth game details are as follows: The first time Hoffman appeared for the fourth time in five days was April 2, and he entered the game after relievers Little, Green, and Yimi Garcia. Given that it was early in the season, Hoffman was well-rested. He pitched an inning and gave up one run in Toronto’s 4-2 win over Washington. The second instance was on May 10 when he replaced Mason Fluharty in the ninth inning. If Little appeared, it would have been his third appearance in four days, and one day after going one and two-thirds innings on May 9. Rodriguez had pitched one and one-third innings on May 7 and two innings on May 8, and would not have been available on May 11 for his one and one-third innings. Garcia and Green were well-rested. Hoffman struck the three batters he faced and earned the save in Toronto’s 6-3 win over Seattle. On June 10, Hoffman, Fluharty, and Green appeared. Hoffman pitched one-third of an inning and surrendered a solo home run in Toronto’s 10-9 victory over St. Louis. Garcia was on his May 24 to July 1 tenure on the Injured List. Rodriguez pitched one and one-third innings on June 6 and again on June 9, and would not have been available for his June 11 outing. Hoffman appeared in the July 3 game against the Yankees. He was Toronto’s fourth reliever (Braydon Fisher, Green, and Justin Bruihl were the other relievers) in the 8-5 win for the Blue Jays. Hoffman surrendered a hit in a scoreless, one-inning appearance. If Rodriguez pitched, it would have been his third outing in three days. A July 3 outing for Little would have been four games in five days. In the July 22 Yankees game, Hoffman entered the game in the top of the ninth and surrendered a game-winning home run. Fluharty and Bruihl preceded Hoffman in this game. If Rodriguez or Little were used instead of Hoffman, it would have been four outings in five days for either. Overall, in 18 innings, over the five times that he made four appearances in five days, Hoffman’s 0.274 xwOBA is lower than the .319 MLB average. His 3.85 FIP is better than MLB’s 4.05 FIP. During the first three games of the four outings in five days, his average xwOBA and FIP are .209 and 2.78, respectively. Hence, on average, Hoffman has pitched well in the first three games of the four-game block. His Game Four average xwOBA and FIP scores are .472 and 7.24, respectively. Concerning rest after the game fours, Hoffman had two days’ rest on three occasions and two six-day respites. The key takeaways from the noted Hoffman usage are as follows. First, Schneider is no doubt aware of the likelihood of the game four underperformance by a reliever. However, other than possibly the May 10 game, Schneider’s use of Hoffman on April 2, June 10, and the two July games was reasonable. He did not have better options at the time when he made his calls to the bullpen. Second, Hoffman was given ample relief from relief work after the Game Fours. Having to use Hoffman in four games in five days was less than ideal, but reasonable. Another way to look at reliever usage is the number of outings by month. Lo and behold, Table 2! The average number of outings for Toronto’s five relievers by month is like Houston’s. Concerning Hoffman and Hader, their monthly totals are alike, as are those of Little and Abreu. Let us explore a potential connection between monthly usage, days of rest, and performance for Toronto’s relievers. Is there a table to view? No! There are two! Please refer to Table 3 and Table 4. Concerning Hoffman, there is no apparent connection between monthly usage, days of rest, and performance. His performance has been inconsistent month-to-month despite similar usage and rest. In the case of Little, the claims that his “performance has declined because of an extreme workload” are unfounded. First, as I noted earlier, Little’s workload is similar to Abreu’s. Also, at the end of July, Little was on pace to pitch in 72 innings, almost identical to 2024’s 63 innings and 2023’s 73. Therefore, the data indicate that Schneider has not overworked Little. The second matter to note is how consistent Little’s xwOBA has been month-to-month: his monthly xwOBA has been lower than the MLB Average. Regarding Table 4, there is no strong relationship between monthly usage, rest, and performance for Rodriguez, Fisher, or Fluharty. One should refrain from drawing any conclusions from the August data due to the small sample size. It is noteworthy that Fisher’s performance has been remarkably consistent for a rookie. Additionally, Fluharty, after a rough June and four July outings with Buffalo, returned to an MLB mound on July 22. In July, his .205 xwOBA (MLB only) was his best month to date. One can question, for example, why Hoffman remained in the game after the third or fourth walk surrendered to the Dodgers on August 10. There are other moves made or not made that one can call into question. However, the focus of this article is strictly on usage in terms of rest days and the number of outings by month. In summary, the days of rest and monthly usage data do not support the view that Schneider has mismanaged his bullpen. The Last Word Toronto's bullpen has performed well this season. The Blue Jays’ reliever corps ranks sixth in xwOBA among American League teams. The Seranthony Domínguez and Louis Varland trade-deadline acquisitions bolstered Toronto’s bullpen. Regarding managing the relievers in terms of rest and number of outings by month, Schneider has operated the bullpen well. On average, the distribution of rest days and the number of outings by month mirrors that of Houston, arguably the best bullpen in the American League. The relievers of primary focus, Hoffman and Little, have usage patterns similar to those of Houston’s Hader and Abreu. Overall, Toronto’s bullpen is well-rested for the push to clinch the American League East Division title.
 -
A frequent conversation among armchair field managers is whether John Schneider uses some relievers more than he should, to the point that those bullpen arms underperform due to fatigue. Two of the names that appear the most in those discussions are Jeff Hoffman and Brendon Little. Has Schneider used these two relievers excessively? How does the Blue Jays' bullpen usage compare to the Houston Astros, one of the better American League bullpens? Let’s find some tables! My bullpen usage examination will consider two aspects of reliever management: the average number of days between appearances and the average number of outings per month. I selected Houston's bullpen as the comparison because it leads the American League in xERA and WPA. Table 1 is the first chart on the agenda. The data presented is the five current Toronto relievers with the most innings pitched as a Blue Jay in 2025. Please note that I excluded Chad Green, who Toronto designated for assignment on July 29 and released on August 3, who ranks fifth in innings pitched among Blue Jay relievers. The Houston average is for its five relievers with the most innings. I also present the numbers for Josh Hader, Houston’s closer, and Bryan Abreu, the Astro with the most holds (25). These two relievers are comparable to Hoffman (Toronto’s closer) and Little, who leads Toronto with 24 holds. The average number of days between outings for Toronto and Houston is similar. The exception is Toronto’s listed relievers have averaged 18 outings on one day’s rest, whereas Houston’s bullpen arms have averaged 14. Regarding the closers, Hoffman has 15 appearances on zero days’ rest, five more than Hader. On less than two days’ rest, Hoffman has 31 outings, six more than Hader. It is noteworthy that Hader is on the 15-day Injured List with a shoulder strain, and reporters expect him to be on the sidelines beyond the 15 days. He has not pitched since August 8. After August 8, Hoffman has appeared four times: one on six days' rest, two on one day's rest, and one on zero days off. Therefore, before August 9, Hoffman had 49 outings, and 28 on less than two days' rest. Thus, according to Table 1, there is not much difference in usage between Hoffman and Hader. Regarding Little and Abreu, Little has 26 outings on one day of rest, higher than Abreu’s 16. Yet, Little’s 34 outings with less than two days’ rest are not significantly more than those of Abreu’s 30. With days of rest less than four days but more than one, Abreu’s 19 appearances are equal to Little’s 19. In other words, Little’s workload in terms of rest days is not dissimilar from Abreu’s. One aspect of Hoffman’s usage is that he has, on five occasions, pitched four times in five days. In 2025, Hader has not pitched four times in five days. Except for Boston’s Aroldis Chapman, I did not examine other American League closers concerning four appearances over five days. Chapman has pitched four times in five days on two occasions. Hence, Hoffman’s concentrated usage over five days is unusual. However, I would be reluctant to criticize Schneider for Hoffman’s usage in the noted five-day stretches. The fourth game details are as follows: The first time Hoffman appeared for the fourth time in five days was April 2, and he entered the game after relievers Little, Green, and Yimi Garcia. Given that it was early in the season, Hoffman was well-rested. He pitched an inning and gave up one run in Toronto’s 4-2 win over Washington. The second instance was on May 10 when he replaced Mason Fluharty in the ninth inning. If Little appeared, it would have been his third appearance in four days, and one day after going one and two-thirds innings on May 9. Rodriguez had pitched one and one-third innings on May 7 and two innings on May 8, and would not have been available on May 11 for his one and one-third innings. Garcia and Green were well-rested. Hoffman struck the three batters he faced and earned the save in Toronto’s 6-3 win over Seattle. On June 10, Hoffman, Fluharty, and Green appeared. Hoffman pitched one-third of an inning and surrendered a solo home run in Toronto’s 10-9 victory over St. Louis. Garcia was on his May 24 to July 1 tenure on the Injured List. Rodriguez pitched one and one-third innings on June 6 and again on June 9, and would not have been available for his June 11 outing. Hoffman appeared in the July 3 game against the Yankees. He was Toronto’s fourth reliever (Braydon Fisher, Green, and Justin Bruihl were the other relievers) in the 8-5 win for the Blue Jays. Hoffman surrendered a hit in a scoreless, one-inning appearance. If Rodriguez pitched, it would have been his third outing in three days. A July 3 outing for Little would have been four games in five days. In the July 22 Yankees game, Hoffman entered the game in the top of the ninth and surrendered a game-winning home run. Fluharty and Bruihl preceded Hoffman in this game. If Rodriguez or Little were used instead of Hoffman, it would have been four outings in five days for either. Overall, in 18 innings, over the five times that he made four appearances in five days, Hoffman’s 0.274 xwOBA is lower than the .319 MLB average. His 3.85 FIP is better than MLB’s 4.05 FIP. During the first three games of the four outings in five days, his average xwOBA and FIP are .209 and 2.78, respectively. Hence, on average, Hoffman has pitched well in the first three games of the four-game block. His Game Four average xwOBA and FIP scores are .472 and 7.24, respectively. Concerning rest after the game fours, Hoffman had two days’ rest on three occasions and two six-day respites. The key takeaways from the noted Hoffman usage are as follows. First, Schneider is no doubt aware of the likelihood of the game four underperformance by a reliever. However, other than possibly the May 10 game, Schneider’s use of Hoffman on April 2, June 10, and the two July games was reasonable. He did not have better options at the time when he made his calls to the bullpen. Second, Hoffman was given ample relief from relief work after the Game Fours. Having to use Hoffman in four games in five days was less than ideal, but reasonable. Another way to look at reliever usage is the number of outings by month. Lo and behold, Table 2! The average number of outings for Toronto’s five relievers by month is like Houston’s. Concerning Hoffman and Hader, their monthly totals are alike, as are those of Little and Abreu. Let us explore a potential connection between monthly usage, days of rest, and performance for Toronto’s relievers. Is there a table to view? No! There are two! Please refer to Table 3 and Table 4. Concerning Hoffman, there is no apparent connection between monthly usage, days of rest, and performance. His performance has been inconsistent month-to-month despite similar usage and rest. In the case of Little, the claims that his “performance has declined because of an extreme workload” are unfounded. First, as I noted earlier, Little’s workload is similar to Abreu’s. Also, at the end of July, Little was on pace to pitch in 72 innings, almost identical to 2024’s 63 innings and 2023’s 73. Therefore, the data indicate that Schneider has not overworked Little. The second matter to note is how consistent Little’s xwOBA has been month-to-month: his monthly xwOBA has been lower than the MLB Average. Regarding Table 4, there is no strong relationship between monthly usage, rest, and performance for Rodriguez, Fisher, or Fluharty. One should refrain from drawing any conclusions from the August data due to the small sample size. It is noteworthy that Fisher’s performance has been remarkably consistent for a rookie. Additionally, Fluharty, after a rough June and four July outings with Buffalo, returned to an MLB mound on July 22. In July, his .205 xwOBA (MLB only) was his best month to date. One can question, for example, why Hoffman remained in the game after the third or fourth walk surrendered to the Dodgers on August 10. There are other moves made or not made that one can call into question. However, the focus of this article is strictly on usage in terms of rest days and the number of outings by month. In summary, the days of rest and monthly usage data do not support the view that Schneider has mismanaged his bullpen. The Last Word Toronto's bullpen has performed well this season. The Blue Jays’ reliever corps ranks sixth in xwOBA among American League teams. The Seranthony Domínguez and Louis Varland trade-deadline acquisitions bolstered Toronto’s bullpen. Regarding managing the relievers in terms of rest and number of outings by month, Schneider has operated the bullpen well. On average, the distribution of rest days and the number of outings by month mirrors that of Houston, arguably the best bullpen in the American League. The relievers of primary focus, Hoffman and Little, have usage patterns similar to those of Houston’s Hader and Abreu. Overall, Toronto’s bullpen is well-rested for the push to clinch the American League East Division title. View full article
-
.jpg.6bfed096e7424d57d251b037ae6e93db.jpg) On MLB’s trade deadline day, Toronto acquired Louis Varland and Ty France from the Minnesota Twins in exchange for Alan Roden and Kendry Rojas. In the article, "Louis Varland (and Ty France) Are Good Players Who Came at a Sizable Cost," Simon Li examined the price paid by Toronto to acquire Varland and France. I reviewed Varland’s impact on Toronto’s bullpen in the piece, "How Will Seranthony Domínguez and Louis Varland Impact the Blue Jays’ Bullpen?". However, many observers reacted to the Blue Jays’ acquisition of France with puzzlement. Let us see what France brings to the table. France is a 30-year-old first baseman with seven seasons of MLB experience. His best MLB campaign was in 2021 when he posted a 3.2 fWAR and a 129 wRC+. However, as Table 1 shows, France’s wRC+ has deteriorated since 2021. Additionally, except for 2022, his ISO has been lower than the MLB average for the noted seasons. Concerning 2025 handedness splits, he has a 100 wRC+ versus left-handed pitchers and a 94 against right-handers; neither wRC+ score suggests a capable platoon player. There's more. His sprint speed ranks in the fifth percentile, and his GIDP% is 10.7%, higher than the 9.4% MLB average. Geez, is there any good news? Yes! Except for 2024, his OBP has exceeded the MLB average in each year during the 2021-2025 period. In 2025, his first base defence has been above average (tied for third with a +5 Fielding Run Value). Additionally, as I noted in the article, "Andrés Giménez: Hit Me With Your Best Shot," starting in 2022, no player has been hit by more pitches than France. In summary, France appears to be a slow-footed, defence-first player who gets on base at a better-than-average rate but does so with below-average power, grounds into double plays at an excessive rate, and does not offer excellence against lefties or righties. That does not sound appealing. Please don't worry, there are more tables to come. The key metric in the Case for France is xwOBA minus wOBA. Among the reasons why xwOBA can exceed wOBA are batter foot speed and bad luck. Concerning foot speed, slow runners can, for example, turn what xwOBA considers a likely double into a single (which would be the wOBA input). France and Alejandro Kirk (second percentile sprint speed ranking) are among the slowest runners on any MLB roster. All else being equal, a slow runner will have a positive xwOBA-wOBA differential. Regarding bad luck/randomness, there are elements of a play that a batter cannot control, including the quality of defence faced and hitting or not hitting pitches right at fielders. A run of bad luck will increase a player's xwOBA-wOBA differential. Therefore, we should not be surprised to see positive regression occur in the future for batters with a recent run of bad luck. Table 2 shows sprint speed, wOBA and xwOBA over the past five seasons for France, Kirk, George Springer, and old friend, Teoscar Hernández. The data shows that regardless of foot speed, be it the slow-poke Kirk or the speedier Teo, batters can have positive or negative xwOBA-wOBA differentials. Admittedly, the data for these four batters make for a small sample. However, because it makes sense intuitively, it is reasonable to conclude that a positive xwOBA-wOBA difference can, in part, be due to foot speed. However, part of the difference can also be attributable to bad luck, in which case regression can occur. Hence, we should not be surprised if France shows better “actual” results in the future than his current wOBA indicates. How impactful has bad luck been on France’s 2025 results? Suppose France’s xwOBA-wOBA delta is due solely to bad luck. His 2025 xwOBA-wOBA difference is 34 points [(0.342 – 0.308) x 1000]. In wRC+ terms, France's 0.308 wOBA translates into a 95 wRC+, while a 0.342 corresponds (approximately) with a 120 wRC+. That 25-point wRC+ difference is significant. I have assumed that France’s expected stats indicate better “actual” performance for the balance of the 2025 season. Accordingly, let us examine how Toronto could use France. Consider Table 3. When facing right-handed pitchers, France’s 0.333 xwOBA translates into a 113 wRC+, and his 0.155 xISO (xSLG–xBA) is league average. The more interesting component of France’s batting is how he has performed against left-handed pitchers. His 0.363 xwOBA corresponds to a 134 wRC+, and his xISO is 0.234, well above the 0.156 MLB average ISO. Those two metrics are attractive. How do France’s xwOBA stats compare to those of other Blue Jays? Consider Table 4. Against left-handed pitchers, France’s xwOBA ranks as the third highest among the listed Blue Jays. This grade makes France a valuable bat for Toronto. He could pinch-hit for Addison Barger or Joey Loperfido when a lefty is on the mound. Another option for manager John Schneider would be to have France play first base or be the designated hitter when Toronto faces a left-handed starter. Additionally, France and his 0.333 xwOBA could start at first base against a right-handed starter in games when Vladimir Guerrero Jr. has the day off. Toronto’s acquisition of France was reasonable. His expected batting metrics suggest that he is an above-average batter with power when facing left-handed pitchers. Also, his first base defence is superior to Guerrero Jr.'s; the latter has a -1 Fielding Run Value, tied for tenth highest among qualified first basemen. It appears that Toronto prefers having France play first base rather than playing someone such as Ernie Clement out of position. Additionally, France is an insurance policy in case one of Toronto’s less-experienced position players falters as the 2025 season progresses. So, let’s go, Ty! Not so fast. Toronto’s acquisition of France creates a roster issue. Andrés Giménez is nearing the end of his stint on the injured list and, accordingly, Toronto will soon have to make a spot for him on the 26-man roster. The likely candidate to leave the roster is Buddy Kennedy. However, Springer will also need a place on the roster when he returns from the seven-day injured list. That means that one of the outfielders (Barger, Loperfido, Davis Schneider, Nathan Lukes, or Myles Straw) or France is a candidate for removal from the roster. I assume the Blue Jays will not want to reduce the number of pitchers from 13 to 12 when they add back Springer. Of the listed candidates, Barger, Loperfido, Schneider, and Lukes have minor league options. Therefore, Toronto can send them to Buffalo without putting them on waivers. Concerning Straw and France, neither of whom has any remaining minor league options, Toronto would have to designate either for assignment to clear a space on the 26-man roster for Springer. From a roster management perspective, if Toronto wants to make space for Springer but not risk losing a player to a waiver claim, then Toronto should send one of the players with minor league options to Buffalo. However, all four have played well this season. It would be a tough decision to make. On the bright side, rosters expand from 26 to 28 on September 1. Therefore, the Buffalo-bound outfielder could be back in Toronto in a few weeks. Alternatively, Toronto could make way for Springer by designating France for assignment, hoping he clears waivers and bringing him back in September. This France decision would be difficult, made more challenging because France, based on his expected batting metrics and defence, should prove to be a valuable contributor to Toronto’s 2025 fortunes. The Last Word Initially, Toronto’s acquisition of France at the trade deadline was puzzling. His box score batting metrics are near-average, and his wRC+ has been in decline since his 2021 breakout season. However, France’s expected batting metrics suggest better performance in the future, particularly against left-handed pitchers. However, from the No-Good-Deed-Goes-Unpunished School of Baseball Management, having France on the 26-man roster with the impending return of Springer creates a roster-move decision for Toronto. Let us see how the roster juggling unfolds!
On MLB’s trade deadline day, Toronto acquired Louis Varland and Ty France from the Minnesota Twins in exchange for Alan Roden and Kendry Rojas. In the article, "Louis Varland (and Ty France) Are Good Players Who Came at a Sizable Cost," Simon Li examined the price paid by Toronto to acquire Varland and France. I reviewed Varland’s impact on Toronto’s bullpen in the piece, "How Will Seranthony Domínguez and Louis Varland Impact the Blue Jays’ Bullpen?". However, many observers reacted to the Blue Jays’ acquisition of France with puzzlement. Let us see what France brings to the table. France is a 30-year-old first baseman with seven seasons of MLB experience. His best MLB campaign was in 2021 when he posted a 3.2 fWAR and a 129 wRC+. However, as Table 1 shows, France’s wRC+ has deteriorated since 2021. Additionally, except for 2022, his ISO has been lower than the MLB average for the noted seasons. Concerning 2025 handedness splits, he has a 100 wRC+ versus left-handed pitchers and a 94 against right-handers; neither wRC+ score suggests a capable platoon player. There's more. His sprint speed ranks in the fifth percentile, and his GIDP% is 10.7%, higher than the 9.4% MLB average. Geez, is there any good news? Yes! Except for 2024, his OBP has exceeded the MLB average in each year during the 2021-2025 period. In 2025, his first base defence has been above average (tied for third with a +5 Fielding Run Value). Additionally, as I noted in the article, "Andrés Giménez: Hit Me With Your Best Shot," starting in 2022, no player has been hit by more pitches than France. In summary, France appears to be a slow-footed, defence-first player who gets on base at a better-than-average rate but does so with below-average power, grounds into double plays at an excessive rate, and does not offer excellence against lefties or righties. That does not sound appealing. Please don't worry, there are more tables to come. The key metric in the Case for France is xwOBA minus wOBA. Among the reasons why xwOBA can exceed wOBA are batter foot speed and bad luck. Concerning foot speed, slow runners can, for example, turn what xwOBA considers a likely double into a single (which would be the wOBA input). France and Alejandro Kirk (second percentile sprint speed ranking) are among the slowest runners on any MLB roster. All else being equal, a slow runner will have a positive xwOBA-wOBA differential. Regarding bad luck/randomness, there are elements of a play that a batter cannot control, including the quality of defence faced and hitting or not hitting pitches right at fielders. A run of bad luck will increase a player's xwOBA-wOBA differential. Therefore, we should not be surprised to see positive regression occur in the future for batters with a recent run of bad luck. Table 2 shows sprint speed, wOBA and xwOBA over the past five seasons for France, Kirk, George Springer, and old friend, Teoscar Hernández. The data shows that regardless of foot speed, be it the slow-poke Kirk or the speedier Teo, batters can have positive or negative xwOBA-wOBA differentials. Admittedly, the data for these four batters make for a small sample. However, because it makes sense intuitively, it is reasonable to conclude that a positive xwOBA-wOBA difference can, in part, be due to foot speed. However, part of the difference can also be attributable to bad luck, in which case regression can occur. Hence, we should not be surprised if France shows better “actual” results in the future than his current wOBA indicates. How impactful has bad luck been on France’s 2025 results? Suppose France’s xwOBA-wOBA delta is due solely to bad luck. His 2025 xwOBA-wOBA difference is 34 points [(0.342 – 0.308) x 1000]. In wRC+ terms, France's 0.308 wOBA translates into a 95 wRC+, while a 0.342 corresponds (approximately) with a 120 wRC+. That 25-point wRC+ difference is significant. I have assumed that France’s expected stats indicate better “actual” performance for the balance of the 2025 season. Accordingly, let us examine how Toronto could use France. Consider Table 3. When facing right-handed pitchers, France’s 0.333 xwOBA translates into a 113 wRC+, and his 0.155 xISO (xSLG–xBA) is league average. The more interesting component of France’s batting is how he has performed against left-handed pitchers. His 0.363 xwOBA corresponds to a 134 wRC+, and his xISO is 0.234, well above the 0.156 MLB average ISO. Those two metrics are attractive. How do France’s xwOBA stats compare to those of other Blue Jays? Consider Table 4. Against left-handed pitchers, France’s xwOBA ranks as the third highest among the listed Blue Jays. This grade makes France a valuable bat for Toronto. He could pinch-hit for Addison Barger or Joey Loperfido when a lefty is on the mound. Another option for manager John Schneider would be to have France play first base or be the designated hitter when Toronto faces a left-handed starter. Additionally, France and his 0.333 xwOBA could start at first base against a right-handed starter in games when Vladimir Guerrero Jr. has the day off. Toronto’s acquisition of France was reasonable. His expected batting metrics suggest that he is an above-average batter with power when facing left-handed pitchers. Also, his first base defence is superior to Guerrero Jr.'s; the latter has a -1 Fielding Run Value, tied for tenth highest among qualified first basemen. It appears that Toronto prefers having France play first base rather than playing someone such as Ernie Clement out of position. Additionally, France is an insurance policy in case one of Toronto’s less-experienced position players falters as the 2025 season progresses. So, let’s go, Ty! Not so fast. Toronto’s acquisition of France creates a roster issue. Andrés Giménez is nearing the end of his stint on the injured list and, accordingly, Toronto will soon have to make a spot for him on the 26-man roster. The likely candidate to leave the roster is Buddy Kennedy. However, Springer will also need a place on the roster when he returns from the seven-day injured list. That means that one of the outfielders (Barger, Loperfido, Davis Schneider, Nathan Lukes, or Myles Straw) or France is a candidate for removal from the roster. I assume the Blue Jays will not want to reduce the number of pitchers from 13 to 12 when they add back Springer. Of the listed candidates, Barger, Loperfido, Schneider, and Lukes have minor league options. Therefore, Toronto can send them to Buffalo without putting them on waivers. Concerning Straw and France, neither of whom has any remaining minor league options, Toronto would have to designate either for assignment to clear a space on the 26-man roster for Springer. From a roster management perspective, if Toronto wants to make space for Springer but not risk losing a player to a waiver claim, then Toronto should send one of the players with minor league options to Buffalo. However, all four have played well this season. It would be a tough decision to make. On the bright side, rosters expand from 26 to 28 on September 1. Therefore, the Buffalo-bound outfielder could be back in Toronto in a few weeks. Alternatively, Toronto could make way for Springer by designating France for assignment, hoping he clears waivers and bringing him back in September. This France decision would be difficult, made more challenging because France, based on his expected batting metrics and defence, should prove to be a valuable contributor to Toronto’s 2025 fortunes. The Last Word Initially, Toronto’s acquisition of France at the trade deadline was puzzling. His box score batting metrics are near-average, and his wRC+ has been in decline since his 2021 breakout season. However, France’s expected batting metrics suggest better performance in the future, particularly against left-handed pitchers. However, from the No-Good-Deed-Goes-Unpunished School of Baseball Management, having France on the 26-man roster with the impending return of Springer creates a roster-move decision for Toronto. Let us see how the roster juggling unfolds! -
On MLB’s trade deadline day, Toronto acquired Louis Varland and Ty France from the Minnesota Twins in exchange for Alan Roden and Kendry Rojas. In the article, "Louis Varland (and Ty France) Are Good Players Who Came at a Sizable Cost," Simon Li examined the price paid by Toronto to acquire Varland and France. I reviewed Varland’s impact on Toronto’s bullpen in the piece, "How Will Seranthony Domínguez and Louis Varland Impact the Blue Jays’ Bullpen?". However, many observers reacted to the Blue Jays’ acquisition of France with puzzlement. Let us see what France brings to the table. France is a 30-year-old first baseman with seven seasons of MLB experience. His best MLB campaign was in 2021 when he posted a 3.2 fWAR and a 129 wRC+. However, as Table 1 shows, France’s wRC+ has deteriorated since 2021. Additionally, except for 2022, his ISO has been lower than the MLB average for the noted seasons. Concerning 2025 handedness splits, he has a 100 wRC+ versus left-handed pitchers and a 94 against right-handers; neither wRC+ score suggests a capable platoon player. There's more. His sprint speed ranks in the fifth percentile, and his GIDP% is 10.7%, higher than the 9.4% MLB average. Geez, is there any good news? Yes! Except for 2024, his OBP has exceeded the MLB average in each year during the 2021-2025 period. In 2025, his first base defence has been above average (tied for third with a +5 Fielding Run Value). Additionally, as I noted in the article, "Andrés Giménez: Hit Me With Your Best Shot," starting in 2022, no player has been hit by more pitches than France. In summary, France appears to be a slow-footed, defence-first player who gets on base at a better-than-average rate but does so with below-average power, grounds into double plays at an excessive rate, and does not offer excellence against lefties or righties. That does not sound appealing. Please don't worry, there are more tables to come. The key metric in the Case for France is xwOBA minus wOBA. Among the reasons why xwOBA can exceed wOBA are batter foot speed and bad luck. Concerning foot speed, slow runners can, for example, turn what xwOBA considers a likely double into a single (which would be the wOBA input). France and Alejandro Kirk (second percentile sprint speed ranking) are among the slowest runners on any MLB roster. All else being equal, a slow runner will have a positive xwOBA-wOBA differential. Regarding bad luck/randomness, there are elements of a play that a batter cannot control, including the quality of defence faced and hitting or not hitting pitches right at fielders. A run of bad luck will increase a player's xwOBA-wOBA differential. Therefore, we should not be surprised to see positive regression occur in the future for batters with a recent run of bad luck. Table 2 shows sprint speed, wOBA and xwOBA over the past five seasons for France, Kirk, George Springer, and old friend, Teoscar Hernández. The data shows that regardless of foot speed, be it the slow-poke Kirk or the speedier Teo, batters can have positive or negative xwOBA-wOBA differentials. Admittedly, the data for these four batters make for a small sample. However, because it makes sense intuitively, it is reasonable to conclude that a positive xwOBA-wOBA difference can, in part, be due to foot speed. However, part of the difference can also be attributable to bad luck, in which case regression can occur. Hence, we should not be surprised if France shows better “actual” results in the future than his current wOBA indicates. How impactful has bad luck been on France’s 2025 results? Suppose France’s xwOBA-wOBA delta is due solely to bad luck. His 2025 xwOBA-wOBA difference is 34 points [(0.342 – 0.308) x 1000]. In wRC+ terms, France's 0.308 wOBA translates into a 95 wRC+, while a 0.342 corresponds (approximately) with a 120 wRC+. That 25-point wRC+ difference is significant. I have assumed that France’s expected stats indicate better “actual” performance for the balance of the 2025 season. Accordingly, let us examine how Toronto could use France. Consider Table 3. When facing right-handed pitchers, France’s 0.333 xwOBA translates into a 113 wRC+, and his 0.155 xISO (xSLG–xBA) is league average. The more interesting component of France’s batting is how he has performed against left-handed pitchers. His 0.363 xwOBA corresponds to a 134 wRC+, and his xISO is 0.234, well above the 0.156 MLB average ISO. Those two metrics are attractive. How do France’s xwOBA stats compare to those of other Blue Jays? Consider Table 4. Against left-handed pitchers, France’s xwOBA ranks as the third highest among the listed Blue Jays. This grade makes France a valuable bat for Toronto. He could pinch-hit for Addison Barger or Joey Loperfido when a lefty is on the mound. Another option for manager John Schneider would be to have France play first base or be the designated hitter when Toronto faces a left-handed starter. Additionally, France and his 0.333 xwOBA could start at first base against a right-handed starter in games when Vladimir Guerrero Jr. has the day off. Toronto’s acquisition of France was reasonable. His expected batting metrics suggest that he is an above-average batter with power when facing left-handed pitchers. Also, his first base defence is superior to Guerrero Jr.'s; the latter has a -1 Fielding Run Value, tied for tenth highest among qualified first basemen. It appears that Toronto prefers having France play first base rather than playing someone such as Ernie Clement out of position. Additionally, France is an insurance policy in case one of Toronto’s less-experienced position players falters as the 2025 season progresses. So, let’s go, Ty! Not so fast. Toronto’s acquisition of France creates a roster issue. Andrés Giménez is nearing the end of his stint on the injured list and, accordingly, Toronto will soon have to make a spot for him on the 26-man roster. The likely candidate to leave the roster is Buddy Kennedy. However, Springer will also need a place on the roster when he returns from the seven-day injured list. That means that one of the outfielders (Barger, Loperfido, Davis Schneider, Nathan Lukes, or Myles Straw) or France is a candidate for removal from the roster. I assume the Blue Jays will not want to reduce the number of pitchers from 13 to 12 when they add back Springer. Of the listed candidates, Barger, Loperfido, Schneider, and Lukes have minor league options. Therefore, Toronto can send them to Buffalo without putting them on waivers. Concerning Straw and France, neither of whom has any remaining minor league options, Toronto would have to designate either for assignment to clear a space on the 26-man roster for Springer. From a roster management perspective, if Toronto wants to make space for Springer but not risk losing a player to a waiver claim, then Toronto should send one of the players with minor league options to Buffalo. However, all four have played well this season. It would be a tough decision to make. On the bright side, rosters expand from 26 to 28 on September 1. Therefore, the Buffalo-bound outfielder could be back in Toronto in a few weeks. Alternatively, Toronto could make way for Springer by designating France for assignment, hoping he clears waivers and bringing him back in September. This France decision would be difficult, made more challenging because France, based on his expected batting metrics and defence, should prove to be a valuable contributor to Toronto’s 2025 fortunes. The Last Word Initially, Toronto’s acquisition of France at the trade deadline was puzzling. His box score batting metrics are near-average, and his wRC+ has been in decline since his 2021 breakout season. However, France’s expected batting metrics suggest better performance in the future, particularly against left-handed pitchers. However, from the No-Good-Deed-Goes-Unpunished School of Baseball Management, having France on the 26-man roster with the impending return of Springer creates a roster-move decision for Toronto. Let us see how the roster juggling unfolds! View full article
-
Before the July 31 trade deadline, the Toronto Blue Jays acquired two relievers, Seranthony Domínguez and Louis Varland. The additions were needed because the Blue Jays’ bullpen, as I showed in Table 4 of the article, Trade Deadline Options to Bolster the Blue Jays’ Bullpen, lagged the xERA performance levels of the Astros, Red Sox and Yankees. The question to answer is whether Toronto bolstered the bullpen enough? I divided this article into three sections: A Domínguez and Varland overview How do Domínguez and Varland change the profile of Toronto’s bullpen? Did Toronto bolster the bullpen enough? A Domínguez and Varland Overview Domínguez, who was born in the Dominican Republic, was signed by the Phillies in 2018. He is a 30-year-old reliever with seven years of MLB experience. Concerning career leverage situations, 311 (26%) of the 1,211 batters faced were in high-leverage outings, and 425 (35%) were medium-leverage. By comparison, David Bednar, the newly acquired Yankee, has faced 415 (34%) batters in high-leverage situations and 323 (26%) in medium-leverage outings. Domínguez has had postseason success, particularly in Philadelphia’s 2022 run to a World Series appearance with a 1.69 ERA, 0.02 FIP and a 0.32 WPA in 10 2/3 innings. Overall, his postseason record in 17 2/3 innings is a 1.02 ERA, 0.78 FIP and a 0.60 WPA. He will be a free agent after the 2025 season. Varland, who was born in St. Paul, Minnesota, was drafted by the Twins in the 15th round of MLB’s 2019 June Amateur Draft. In 2022, at the age of 24, he made his MLB debut as a starter. In 2023 and 2024, Minnesota used him as a starter (17 outings) and a reliever (16 appearances), which summed to 117 2/3 innings. This season, he has appeared in 52 games (50 innings) as a reliever only. Varland is under team control until 2031. As a reliever, in his career, 18% of the batters faced by Varland occurred in high-leverage situations and 38% in medium-leverage outings. In 2025, Varland has been most frequently in medium-leverage outings (41% of batters faced) and low-leverage situations (38%). Enough of the verbiage, it's table time! Table 1 shows pitch data of Domínguez and Varland. The highlights are as follows: Domínguez has a five-pitch arsenal with the four-seam fastball as his primary offering (43%). When facing right-handed batters, 93% of his pitches are the four-seamer, sweeper, and sinker. Against left-handed hitters, 94% of his offerings consist of the four-seam fastball, splitter, and curveball. His fastball velocity is in the 94th percentile. Like Domínguez, Varland has a five-pitch arsenal, highlighted by the four-seam fastball (45%) and knuckle curve (38%). Against right-handed batters, Varland makes more use of his sinker and slider than he does versus left-handed hitters. When he faces lefties, Varland mixes in his changeup. Varland’s Pitching+ metrics are outstanding. For a description of Pitching+, please refer to FanGraphs. Overall, his pitches have a 116 Pitching+ score, which ranks #27 of 451 pitchers with at least 20 innings pitched. That 116 mark is tied with Paul Skenes. In other words, Varland has electric stuff that he locates well. Table 2 shows a sample of other key metrics for Domínguez and Varland. The vital stats are as follows: Domínguez is a strikeout pitcher, as evidenced by his 32.0 K%, with an elevated 13.3 BB%. Varland has a strikeout rate a tick better than average but a much-better-than-average BB% (76th percentile ranking). Both relievers have performed well in high-leverage situations, but Domínguez has excelled. Concerning batter handedness, the two pitchers have slightly elevated xwOBA scores when facing left-handed batters, which may present matchup challenges for Manager John Schneider. How Do Domínguez and Varland Change the Profile of Toronto’s Bullpen? Table 3 has the answers! The “Toronto’s bullpen before Domínguez and Varland” descriptor refers to the Blue Jays’ overall bullpen metrics as of July 30, 2025. With Toronto’s acquisition of Domínguez and Varland, and compared to the average of the Garcia and Green numbers, the profile of the Blue Jays’ reliever corps should, based on the average of the 2025 Domínguez and Varland data to date, change as follows: Lower HR/9, BB%, Barrel% and Location+ scores. Higher GB%, K%, K%-BB%, Whiff%, Stuff+, and Pitching+ numbers. Additionally, as noted in Table 1, the four-seam fastball average velocities of Domínguez and Varland are 97.7 mph and 98.1 mph, respectively. For the season to date, the average four-seam velocity of Toronto’s bullpen is 95.0 mph. Concerning the sinker, Toronto’s average velocity is 93.4 mph. The corresponding velocities of Domínguez and Varland are 97.9 mph and 96.9 mph, respectively. In summary, Toronto’s acquisition of Domínguez and Varland has altered the bullpen’s profile. The changes to be witnessed include more strikeouts, swing-and-miss and velocity, and fewer home runs. Did Toronto Bolster the Bullpen Enough? By the trade deadline, the New York Yankees added Bednar, Jake Bird, and Camilo Doval to its bullpen. Bednar (85th xERA percentile ranking) would have been a good acquisition for Toronto. However, MLB observers have opined that New York’s bullpen is now so much better than Toronto’s. I disagree, and I have a table to support my position! I constructed Table 4 as follows. First, for each team shown, I ranked their top eight relievers by innings (from most to fewest). So that you know, the xERA and WPA percentile rankings presented are the equally weighted average of the percentile rankings of the eight relievers. For example, I calculated the simple average of the xERA percentile rankings of Houston's eight relievers, which is 76. Second, I determined the impact of trade acquisitions upon a team’s bullpen by dropping the relievers with the lowest xERA percentile rankings and adding each acquisition's xERA and WPA percentile rankings. The total of eight relievers per team was maintained. In the case of Toronto, I included the xERA and WPA percentile rankings of Domínguez and Varland and eliminated Yimi Garcia and Chad Green. For New York, I dropped the three relievers with the lowest xERA percentile rankings and added the xERA and WPA percentile rankings of Bednar, Bird, and Doval. Please note that I have updated the Detroit, Houston and Boston post-deadline numbers. However, because my focus is on the Toronto-New York comparison, this article does not contain the details of the Detroit and Boston trade deadline acquisitions. Also, for the record, Houston did not make a deadline trade for a reliever. Table 4 shows that Toronto’s deadline bullpen additions (and deletions) were more impactful than New York’s. In terms of average xERA percentile rankings, the Blue Jays boosted its bullpen xERA from 59 to 72 (a 13-point delta). The Yankees enhanced their bullpen’s average xERA percentile rankings from 65 to 74 (a nine-point change). Concerning the average WPA percentile rankings, Toronto and New York added 11 percentile ranking points by the trade deadline. Overall, based on the revised average of the xERA and WPA percentile rankings, Toronto's bullpen is slightly better than New York's (74 versus 71). "It's tough to make predictions, especially about the future." — Yogi Berra As always, Yogi is correct. We do not know how the incumbents and new relievers of any team’s bullpen will perform for the balance of the 2025 regular season or the postseason. However, MLB observers have overlooked how good Domínguez and Varland have performed this season. These two relievers should boost the performance level of Toronto’s bullpen. Additionally, if Garcia can get healthy and improve upon his 91 Location+ score (well below his 105-career mark before 2025), the Blue Jays’ reliever corps will be even better. The Last Word The Toronto Blue Jays bolstered their bullpen with the acquisitions of Domínguez and Varland. These two relievers should have a positive impact on Toronto’s bullpen performance metrics, including better HR/9, GB% and K% numbers. Furthermore, from an xERA and WPA perspective, the Domínguez and Varland additions have put Toronto’s reliever corps on par, if not slightly better, with New York, a ballclub close to Toronto in the American League East standings. Now, we wait to see the balance of the 2025 campaign unfold! View full article
-
 Before the July 31 trade deadline, the Toronto Blue Jays acquired two relievers, Seranthony Domínguez and Louis Varland. The additions were needed because the Blue Jays’ bullpen, as I showed in Table 4 of the article, Trade Deadline Options to Bolster the Blue Jays’ Bullpen, lagged the xERA performance levels of the Astros, Red Sox and Yankees. The question to answer is whether Toronto bolstered the bullpen enough? I divided this article into three sections: A Domínguez and Varland overview How do Domínguez and Varland change the profile of Toronto’s bullpen? Did Toronto bolster the bullpen enough? A Domínguez and Varland Overview Domínguez, who was born in the Dominican Republic, was signed by the Phillies in 2018. He is a 30-year-old reliever with seven years of MLB experience. Concerning career leverage situations, 311 (26%) of the 1,211 batters faced were in high-leverage outings, and 425 (35%) were medium-leverage. By comparison, David Bednar, the newly acquired Yankee, has faced 415 (34%) batters in high-leverage situations and 323 (26%) in medium-leverage outings. Domínguez has had postseason success, particularly in Philadelphia’s 2022 run to a World Series appearance with a 1.69 ERA, 0.02 FIP and a 0.32 WPA in 10 2/3 innings. Overall, his postseason record in 17 2/3 innings is a 1.02 ERA, 0.78 FIP and a 0.60 WPA. He will be a free agent after the 2025 season. Varland, who was born in St. Paul, Minnesota, was drafted by the Twins in the 15th round of MLB’s 2019 June Amateur Draft. In 2022, at the age of 24, he made his MLB debut as a starter. In 2023 and 2024, Minnesota used him as a starter (17 outings) and a reliever (16 appearances), which summed to 117 2/3 innings. This season, he has appeared in 52 games (50 innings) as a reliever only. Varland is under team control until 2031. As a reliever, in his career, 18% of the batters faced by Varland occurred in high-leverage situations and 38% in medium-leverage outings. In 2025, Varland has been most frequently in medium-leverage outings (41% of batters faced) and low-leverage situations (38%). Enough of the verbiage, it's table time! Table 1 shows pitch data of Domínguez and Varland. The highlights are as follows: Domínguez has a five-pitch arsenal with the four-seam fastball as his primary offering (43%). When facing right-handed batters, 93% of his pitches are the four-seamer, sweeper, and sinker. Against left-handed hitters, 94% of his offerings consist of the four-seam fastball, splitter, and curveball. His fastball velocity is in the 94th percentile. Like Domínguez, Varland has a five-pitch arsenal, highlighted by the four-seam fastball (45%) and knuckle curve (38%). Against right-handed batters, Varland makes more use of his sinker and slider than he does versus left-handed hitters. When he faces lefties, Varland mixes in his changeup. Varland’s Pitching+ metrics are outstanding. For a description of Pitching+, please refer to FanGraphs. Overall, his pitches have a 116 Pitching+ score, which ranks #27 of 451 pitchers with at least 20 innings pitched. That 116 mark is tied with Paul Skenes. In other words, Varland has electric stuff that he locates well. Table 2 shows a sample of other key metrics for Domínguez and Varland. The vital stats are as follows: Domínguez is a strikeout pitcher, as evidenced by his 32.0 K%, with an elevated 13.3 BB%. Varland has a strikeout rate a tick better than average but a much-better-than-average BB% (76th percentile ranking). Both relievers have performed well in high-leverage situations, but Domínguez has excelled. Concerning batter handedness, the two pitchers have slightly elevated xwOBA scores when facing left-handed batters, which may present matchup challenges for Manager John Schneider. How Do Domínguez and Varland Change the Profile of Toronto’s Bullpen? Table 3 has the answers! The “Toronto’s bullpen before Domínguez and Varland” descriptor refers to the Blue Jays’ overall bullpen metrics as of July 30, 2025. With Toronto’s acquisition of Domínguez and Varland, and compared to the average of the Garcia and Green numbers, the profile of the Blue Jays’ reliever corps should, based on the average of the 2025 Domínguez and Varland data to date, change as follows: Lower HR/9, BB%, Barrel% and Location+ scores. Higher GB%, K%, K%-BB%, Whiff%, Stuff+, and Pitching+ numbers. Additionally, as noted in Table 1, the four-seam fastball average velocities of Domínguez and Varland are 97.7 mph and 98.1 mph, respectively. For the season to date, the average four-seam velocity of Toronto’s bullpen is 95.0 mph. Concerning the sinker, Toronto’s average velocity is 93.4 mph. The corresponding velocities of Domínguez and Varland are 97.9 mph and 96.9 mph, respectively. In summary, Toronto’s acquisition of Domínguez and Varland has altered the bullpen’s profile. The changes to be witnessed include more strikeouts, swing-and-miss and velocity, and fewer home runs. Did Toronto Bolster the Bullpen Enough? By the trade deadline, the New York Yankees added Bednar, Jake Bird, and Camilo Doval to its bullpen. Bednar (85th xERA percentile ranking) would have been a good acquisition for Toronto. However, MLB observers have opined that New York’s bullpen is now so much better than Toronto’s. I disagree, and I have a table to support my position! I constructed Table 4 as follows. First, for each team shown, I ranked their top eight relievers by innings (from most to fewest). So that you know, the xERA and WPA percentile rankings presented are the equally weighted average of the percentile rankings of the eight relievers. For example, I calculated the simple average of the xERA percentile rankings of Houston's eight relievers, which is 76. Second, I determined the impact of trade acquisitions upon a team’s bullpen by dropping the relievers with the lowest xERA percentile rankings and adding each acquisition's xERA and WPA percentile rankings. The total of eight relievers per team was maintained. In the case of Toronto, I included the xERA and WPA percentile rankings of Domínguez and Varland and eliminated Yimi Garcia and Chad Green. For New York, I dropped the three relievers with the lowest xERA percentile rankings and added the xERA and WPA percentile rankings of Bednar, Bird, and Doval. Please note that I have updated the Detroit, Houston and Boston post-deadline numbers. However, because my focus is on the Toronto-New York comparison, this article does not contain the details of the Detroit and Boston trade deadline acquisitions. Also, for the record, Houston did not make a deadline trade for a reliever. Table 4 shows that Toronto’s deadline bullpen additions (and deletions) were more impactful than New York’s. In terms of average xERA percentile rankings, the Blue Jays boosted its bullpen xERA from 59 to 72 (a 13-point delta). The Yankees enhanced their bullpen’s average xERA percentile rankings from 65 to 74 (a nine-point change). Concerning the average WPA percentile rankings, Toronto and New York added 11 percentile ranking points by the trade deadline. Overall, based on the revised average of the xERA and WPA percentile rankings, Toronto's bullpen is slightly better than New York's (74 versus 71). "It's tough to make predictions, especially about the future." — Yogi Berra As always, Yogi is correct. We do not know how the incumbents and new relievers of any team’s bullpen will perform for the balance of the 2025 regular season or the postseason. However, MLB observers have overlooked how good Domínguez and Varland have performed this season. These two relievers should boost the performance level of Toronto’s bullpen. Additionally, if Garcia can get healthy and improve upon his 91 Location+ score (well below his 105-career mark before 2025), the Blue Jays’ reliever corps will be even better. The Last Word The Toronto Blue Jays bolstered their bullpen with the acquisitions of Domínguez and Varland. These two relievers should have a positive impact on Toronto’s bullpen performance metrics, including better HR/9, GB% and K% numbers. Furthermore, from an xERA and WPA perspective, the Domínguez and Varland additions have put Toronto’s reliever corps on par, if not slightly better, with New York, a ballclub close to Toronto in the American League East standings. Now, we wait to see the balance of the 2025 campaign unfold!
 -
Sportsnet’s Ben Nicholson-Smith has reported, and confirmed by other MLB media members, that the Toronto Blue Jays have acquired Seranthony Dominguez from the Baltimore Orioles in exchange for minor-league pitcher Juaron Watts-Brown. Dominguez, a 30-year-old relief right-handed pitcher, has posted excellent numbers this season. His xERA ranks in the 77th percentile, and as of July 23, his WPA was in the 85th percentile. He is a strikeout pitcher (30.9 K%) but walks batters at a high rate (13.7 BB%). The MLB average K% and BB% for relievers are 22.5 and 9.4, respectively. Also, his 0.86 HR/9 is lower than Toronto’s bullpen mark of 1.07. Additionally, Dominguez has postseason experience with the Orioles and the Phillies, including Philadelphia’s appearance in the 2022 World Series. In his postseason career, he has posted a 0.78 FIP and a 0.60 WPA in 17 ⅔ innings. Dominiguez will become a free agent after the 2025 season. In my article, Trade Deadline Reliever Options To Bolster The Blue Jays’ Bullpen, I listed Dominguez in Tier 2 of relievers. His xERA impact on Toronto’s bullpen would be similar to that of Phil Maton and David Bednar. The Dominguez acquisition should elevate the overall performance of Toronto’s bullpen. Watts-Brown is a 23-year-old right-handed pitcher who reached Double A this season, where he posted a 3.48 ERA and a 3.95 FIP. In its recent prospect rankings, Jays Centre recently ranked Watts-Brown 14th on the Blue Jays' top prospects list. Baseball America projected his future as, “Watts-Brown shows projectable starter traits with command of a four-pitch mix and a swing-and-miss weapon in his slider.” The trade makes sense for both Toronto and Baltimore. The Blue Jays need to bolster their bullpen, and Dominguez fills that need. From the Orioles’ perspective, Watts-Brown will join an organization in search of quality pitching and depth. Thanks to forum user @Terminator for starting the comments thread. View full article
-
Blue Jays Acquiring Seranthony Dominguez And Cash For Juaron Watts-Brown
Bob Ritchie posted an article in Blue Jays
 Sportsnet’s Ben Nicholson-Smith has reported, and confirmed by other MLB media members, that the Toronto Blue Jays have acquired Seranthony Dominguez from the Baltimore Orioles in exchange for minor-league pitcher Juaron Watts-Brown. Dominguez, a 30-year-old relief right-handed pitcher, has posted excellent numbers this season. His xERA ranks in the 77th percentile, and as of July 23, his WPA was in the 85th percentile. He is a strikeout pitcher (30.9 K%) but walks batters at a high rate (13.7 BB%). The MLB average K% and BB% for relievers are 22.5 and 9.4, respectively. Also, his 0.86 HR/9 is lower than Toronto’s bullpen mark of 1.07. Additionally, Dominguez has postseason experience with the Orioles and the Phillies, including Philadelphia’s appearance in the 2022 World Series. In his postseason career, he has posted a 0.78 FIP and a 0.60 WPA in 17 ⅔ innings. Dominiguez will become a free agent after the 2025 season. In my article, Trade Deadline Reliever Options To Bolster The Blue Jays’ Bullpen, I listed Dominguez in Tier 2 of relievers. His xERA impact on Toronto’s bullpen would be similar to that of Phil Maton and David Bednar. The Dominguez acquisition should elevate the overall performance of Toronto’s bullpen. Watts-Brown is a 23-year-old right-handed pitcher who reached Double A this season, where he posted a 3.48 ERA and a 3.95 FIP. In its recent prospect rankings, Jays Centre recently ranked Watts-Brown 14th on the Blue Jays' top prospects list. Baseball America projected his future as, “Watts-Brown shows projectable starter traits with command of a four-pitch mix and a swing-and-miss weapon in his slider.” The trade makes sense for both Toronto and Baltimore. The Blue Jays need to bolster their bullpen, and Dominguez fills that need. From the Orioles’ perspective, Watts-Brown will join an organization in search of quality pitching and depth. Thanks to forum user @Terminator for starting the comments thread.
- 19 comments
-
- 2
-

-

-
- seranthony dominguez
- juaron watts brown
- (and 1 more)
-
Trade Deadline Reliever Options To Bolster The Blue Jays’ Bullpen
Bob Ritchie posted an article in Blue Jays
 MLB’s July 31 trade deadline is fast approaching, and the pace of rumours is increasing. Concerning the Toronto Blue Jays, speculation among MLB observers includes the team’s acquisition of a starting pitcher, a right-handed power bat, and bullpen arms. I addressed the starting pitcher topic in my article, The Blue Jays' Top Three Starters Need A Boost At The Trade Deadline: Here Are Options. Now, to turn the focus on bullpen arms. For my analysis, the two key metrics are xERA and WPA. xERA is a good metric to judge a reliever’s performance because it considers the quality of batted-ball contact, strikeouts, walks, and hit-by-pitches, which are elements over which a reliever has a significant degree of influence. WPA is particularly informative regarding a reliever’s performance because it measures the reliever’s impact on winning. In the words of FanGraphs, WPA “doesn’t tell you how well a player performed, it tells you how important their performance was.” On the surface, Toronto’s bullpen does not need a boost. Among American League teams, Toronto is tied with Boston with the second-best xERA, and the Blue Jays’ bullpen corps has the third-highest WPA and is number two in WPA/LI. However, there are issues to consider. As with all pitchers, there is the general risk of injury. Additionally, Yimi Garcia and Nick Sandlin have missed considerable time this season due to injury, including the present moment. Because Toronto’s bullpen depth has been taxed already, a bullpen arm or two could come in handy. Garcia and Chad Green have not pitched well in 2025. Their xERA percentile rankings are 21st and 10th, respectively. Mason Fluharty and Braydon Fisher have posted very good to excellent xERA marks (77th and 94th percentile, respectively). However, they are rookies with minimal MLB experience. Therefore, we may see some negative performance regression as teams adjust to these MLB newbies. Therefore, it would be prudent for Toronto’s management to add quality, experienced relievers before the upcoming trade deadline. Jays Centre’s Braden Ramsey provided the foundation for this article with his piece, 21 Late-Inning Relievers Who Could Be On The Move Before The MLB Trade Deadline. Accordingly, this article will examine those 21 relievers at a high level and then narrow the options down to three bullpen arms, each of whom would bolster Toronto’s bullpen. Let’s dig into the numbers. Consider Table 1 and Table 2. I calculated the xERA, WPA, and WPA/LI percentiles for relievers who have pitched at least 10 innings in 2025 (326 relievers qualified). WPA/LI is informative because it allows the observer to compare two relievers who may not have the same number of high-leverage opportunities. However, to rank the relievers, I excluded WPA/LI and used the average of the xERA and WPA percentile values. The final step in constructing Table 1 was to allocate the 21 relievers into three tiers, with seven relievers in each tier. However, Seth Halvorsen and Kenley Jansen had identical scores of 63, so I moved Jansen into Tier 2. Table 2 shows the xERA, WPA, and WPA/LI percentile rankings of Toronto’s relievers with at least 10 innings under their 2025 belt. Among other data points, Table 1 shows the trade values of the listed relievers. I use Baseball Trade Values as the source for player acquisition costs because it is an objective third-party with a good, yet not perfect, track record. Ultimately, the market determines a player’s trade value, and various factors influence that value, including demand and supply, trade deadline pressure, and different approaches to appraising players. For an explanation of how BTV values players, please refer to this and this. Trade values are a crucial consideration in identifying trade targets. As shown in Table 3, Toronto has limited player capital to make trades. Suppose the Blue Jays acquired Emmanuel Clase. Toronto’s player capital would then be significantly constrained, and accordingly, the Blue Jays' ability to add other players (a starter, a position player, or another reliever) would be reduced. Now, consider Table 4. To determine the hypothetical impact of reliever targets on Toronto’s bullpen, I arbitrarily selected relievers residing in the middle of Tiers 1, 2, and 3. Those pitchers were Clase, Pete Fairbanks, and Griffin Jax. I included Jax because he is a prominent name. However, none of the pitchers listed in Tier 3 excite me. Lastly, I held the number of Toronto’s relievers constant at eight and dropped the Blue Jay with the lowest xERA percentile ranking (Green) if one reliever was acquired. I eliminated Green and Garcia, who have Toronto’s two lowest xERA percentile rankings, if Management added two relievers. Concerning Table 4, there are four observations to note: Individually, Clase, Fairbanks, and Jax would enhance Toronto’s bullpen xERA. The impact on WPA would be minimal, in the case of Clase and Fairbanks, and lessened with Jax in the pen. The xERA and xERA-WPA average value-added would be highest with Clase and Fairbanks. The BTVs of Clase and Jax are very high. Hence, if Toronto acquired either or both, Toronto’s player capital would be significantly depleted. Given the high cost to acquire Clase and Jax, are there other reliever options? Yes, I present Table 5. Suppose Toronto considered Dennis Santana, Phil Maton, and David Bednar (“Scenario 2”) instead of Clase, Fairbanks, and Jax (“Scenario 1”). As Table 5 shows, the difference in the impact upon Toronto’s xERA under Scenario 1 and Scenario 2 is minimal. Additionally, the positive effect on WPA is more pronounced under Scenario 2 than under Scenario 1. For example, the Santana-Maton duo would outpace the Clase-Fairbanks combo (+10 versus +8). Furthermore, if BTV’s trade values are in line with the market, Toronto could achieve the desired xERA and WPA combo performance upgrades at a much lower acquisition cost under Scenario 2 than Scenario 1. In summary, one of the key takeaways from Tables 4 and 5 is that Toronto can strengthen its bullpen by acquiring quality relievers at a relatively low cost in terms of player capital (see Scenario 2). Due to the poor 2025 performances of Garcia and Green, along with the other identified issues, Toronto would greatly benefit from acquiring two of Santana, Maton, and Bednar. Let’s take a closer look at these pitchers: Voila, Table 6. The highlights are as follows: The trio (Santana, Maton, and Bednar) has posted K%-BB% marks better than Toronto’s bullpen corps. Also, those K%-BB% scores are higher than Garcia’s and Green’s. In high and medium-leverage situations, the trio has better FIP numbers than Garcia and Green. Green’s 2.57 HR/9 is tied for sixth highest among the 326 relievers with a minimum of 10 innings pitched. Notably, the trio members have HR/9 rates better than Garcia's and Green's. As Jay Jaffe noted in his article, No-Hitters Are Great, but the Long Ball Still Wins in October, “… in the postseason, home runs account for a higher percentage of runs than in the regular season.” Hence, by acquiring two of the trio members in trade, Toronto should lower its overall HR/9 rate, which would be a positive development. Concerning GB%, St. Louis‘ infield has MLB’s highest OAA (25), and Pittsburgh’s infield ranks third best (19 OAA). Toronto’s infield slides in at number seven with an 11 OAA score. Therefore, although it is unlikely that Toronto’s infield will enhance the fortunes of the trio compared to the infields of their current teams, a higher GB% would alter the profile of Toronto’s bullpen, which is not a bad thing. In terms of batter handedness, the trio members have better xwOBA scores than Garcia and Green, whether against right-handed or left-handed hitters. In other words, any combination of Santana, Maton, or Bednar would not raise platoon-split issues for John Schneider. A final matter to address is the potential 40-man and 26-man roster moves that would be required if Toronto adds one or more bullpen arms. The candidates for these roster moves are Green, Tommy Nance, and Justin Bruihl, all current members of Toronto’s bullpen. Also, if Garcia returns to form, there can still be a roster spot for him. Therefore, concerning roster moves, Toronto has options to make bullpen acquisitions work. The Last Word Toronto would benefit significantly if it acquired one or more quality relievers. Although there are prominent relievers on the market, including Clase and Jax, the cost to acquire them is exceptionally high. A lower-cost option would be for Toronto to target Santana, Maton, and Bednar. The player capital price for this trio should be less than the acquisitions of Clase and Jax would be, and Toronto would still markedly bolster its bullpen. Additionally, Toronto would have more resources remaining to make other acquisitions. Ross Atkins, make it happen!
 -
MLB’s July 31 trade deadline is fast approaching, and the pace of rumours is increasing. Concerning the Toronto Blue Jays, speculation among MLB observers includes the team’s acquisition of a starting pitcher, a right-handed power bat, and bullpen arms. I addressed the starting pitcher topic in my article, The Blue Jays' Top Three Starters Need A Boost At The Trade Deadline: Here Are Options. Now, to turn the focus on bullpen arms. For my analysis, the two key metrics are xERA and WPA. xERA is a good metric to judge a reliever’s performance because it considers the quality of batted-ball contact, strikeouts, walks, and hit-by-pitches, which are elements over which a reliever has a significant degree of influence. WPA is particularly informative regarding a reliever’s performance because it measures the reliever’s impact on winning. In the words of FanGraphs, WPA “doesn’t tell you how well a player performed, it tells you how important their performance was.” On the surface, Toronto’s bullpen does not need a boost. Among American League teams, Toronto is tied with Boston with the second-best xERA, and the Blue Jays’ bullpen corps has the third-highest WPA and is number two in WPA/LI. However, there are issues to consider. As with all pitchers, there is the general risk of injury. Additionally, Yimi Garcia and Nick Sandlin have missed considerable time this season due to injury, including the present moment. Because Toronto’s bullpen depth has been taxed already, a bullpen arm or two could come in handy. Garcia and Chad Green have not pitched well in 2025. Their xERA percentile rankings are 21st and 10th, respectively. Mason Fluharty and Braydon Fisher have posted very good to excellent xERA marks (77th and 94th percentile, respectively). However, they are rookies with minimal MLB experience. Therefore, we may see some negative performance regression as teams adjust to these MLB newbies. Therefore, it would be prudent for Toronto’s management to add quality, experienced relievers before the upcoming trade deadline. Jays Centre’s Braden Ramsey provided the foundation for this article with his piece, 21 Late-Inning Relievers Who Could Be On The Move Before The MLB Trade Deadline. Accordingly, this article will examine those 21 relievers at a high level and then narrow the options down to three bullpen arms, each of whom would bolster Toronto’s bullpen. Let’s dig into the numbers. Consider Table 1 and Table 2. I calculated the xERA, WPA, and WPA/LI percentiles for relievers who have pitched at least 10 innings in 2025 (326 relievers qualified). WPA/LI is informative because it allows the observer to compare two relievers who may not have the same number of high-leverage opportunities. However, to rank the relievers, I excluded WPA/LI and used the average of the xERA and WPA percentile values. The final step in constructing Table 1 was to allocate the 21 relievers into three tiers, with seven relievers in each tier. However, Seth Halvorsen and Kenley Jansen had identical scores of 63, so I moved Jansen into Tier 2. Table 2 shows the xERA, WPA, and WPA/LI percentile rankings of Toronto’s relievers with at least 10 innings under their 2025 belt. Among other data points, Table 1 shows the trade values of the listed relievers. I use Baseball Trade Values as the source for player acquisition costs because it is an objective third-party with a good, yet not perfect, track record. Ultimately, the market determines a player’s trade value, and various factors influence that value, including demand and supply, trade deadline pressure, and different approaches to appraising players. For an explanation of how BTV values players, please refer to this and this. Trade values are a crucial consideration in identifying trade targets. As shown in Table 3, Toronto has limited player capital to make trades. Suppose the Blue Jays acquired Emmanuel Clase. Toronto’s player capital would then be significantly constrained, and accordingly, the Blue Jays' ability to add other players (a starter, a position player, or another reliever) would be reduced. Now, consider Table 4. To determine the hypothetical impact of reliever targets on Toronto’s bullpen, I arbitrarily selected relievers residing in the middle of Tiers 1, 2, and 3. Those pitchers were Clase, Pete Fairbanks, and Griffin Jax. I included Jax because he is a prominent name. However, none of the pitchers listed in Tier 3 excite me. Lastly, I held the number of Toronto’s relievers constant at eight and dropped the Blue Jay with the lowest xERA percentile ranking (Green) if one reliever was acquired. I eliminated Green and Garcia, who have Toronto’s two lowest xERA percentile rankings, if Management added two relievers. Concerning Table 4, there are four observations to note: Individually, Clase, Fairbanks, and Jax would enhance Toronto’s bullpen xERA. The impact on WPA would be minimal, in the case of Clase and Fairbanks, and lessened with Jax in the pen. The xERA and xERA-WPA average value-added would be highest with Clase and Fairbanks. The BTVs of Clase and Jax are very high. Hence, if Toronto acquired either or both, Toronto’s player capital would be significantly depleted. Given the high cost to acquire Clase and Jax, are there other reliever options? Yes, I present Table 5. Suppose Toronto considered Dennis Santana, Phil Maton, and David Bednar (“Scenario 2”) instead of Clase, Fairbanks, and Jax (“Scenario 1”). As Table 5 shows, the difference in the impact upon Toronto’s xERA under Scenario 1 and Scenario 2 is minimal. Additionally, the positive effect on WPA is more pronounced under Scenario 2 than under Scenario 1. For example, the Santana-Maton duo would outpace the Clase-Fairbanks combo (+10 versus +8). Furthermore, if BTV’s trade values are in line with the market, Toronto could achieve the desired xERA and WPA combo performance upgrades at a much lower acquisition cost under Scenario 2 than Scenario 1. In summary, one of the key takeaways from Tables 4 and 5 is that Toronto can strengthen its bullpen by acquiring quality relievers at a relatively low cost in terms of player capital (see Scenario 2). Due to the poor 2025 performances of Garcia and Green, along with the other identified issues, Toronto would greatly benefit from acquiring two of Santana, Maton, and Bednar. Let’s take a closer look at these pitchers: Voila, Table 6. The highlights are as follows: The trio (Santana, Maton, and Bednar) has posted K%-BB% marks better than Toronto’s bullpen corps. Also, those K%-BB% scores are higher than Garcia’s and Green’s. In high and medium-leverage situations, the trio has better FIP numbers than Garcia and Green. Green’s 2.57 HR/9 is tied for sixth highest among the 326 relievers with a minimum of 10 innings pitched. Notably, the trio members have HR/9 rates better than Garcia's and Green's. As Jay Jaffe noted in his article, No-Hitters Are Great, but the Long Ball Still Wins in October, “… in the postseason, home runs account for a higher percentage of runs than in the regular season.” Hence, by acquiring two of the trio members in trade, Toronto should lower its overall HR/9 rate, which would be a positive development. Concerning GB%, St. Louis‘ infield has MLB’s highest OAA (25), and Pittsburgh’s infield ranks third best (19 OAA). Toronto’s infield slides in at number seven with an 11 OAA score. Therefore, although it is unlikely that Toronto’s infield will enhance the fortunes of the trio compared to the infields of their current teams, a higher GB% would alter the profile of Toronto’s bullpen, which is not a bad thing. In terms of batter handedness, the trio members have better xwOBA scores than Garcia and Green, whether against right-handed or left-handed hitters. In other words, any combination of Santana, Maton, or Bednar would not raise platoon-split issues for John Schneider. A final matter to address is the potential 40-man and 26-man roster moves that would be required if Toronto adds one or more bullpen arms. The candidates for these roster moves are Green, Tommy Nance, and Justin Bruihl, all current members of Toronto’s bullpen. Also, if Garcia returns to form, there can still be a roster spot for him. Therefore, concerning roster moves, Toronto has options to make bullpen acquisitions work. The Last Word Toronto would benefit significantly if it acquired one or more quality relievers. Although there are prominent relievers on the market, including Clase and Jax, the cost to acquire them is exceptionally high. A lower-cost option would be for Toronto to target Santana, Maton, and Bednar. The player capital price for this trio should be less than the acquisitions of Clase and Jax would be, and Toronto would still markedly bolster its bullpen. Additionally, Toronto would have more resources remaining to make other acquisitions. Ross Atkins, make it happen! View full article
-
As the MLB deadline approaches, many rumours are swirling around the Blue Jays. Media speculation includes Toronto’s interest in improving the bullpen, acquiring a right-handed power bat, and adding a pitcher to the starting rotation. The performance of the Blue Jays’ starting rotation has declined since 2023, when their starters produced a 3.85 ERA, followed by a 3.95 ERA in 2024 and a 4.55 ERA thus far in 2025. Among American League rotations, those ERA marks ranked second, ninth, and thirteenth, respectively. Part of that decline in 2025 is attributable to the underperformance of the starters not named José Berrios, Kevin Gausman, Chris Bassitt, Max Scherzer, and Bowden Francis. The other starters have produced a 5.79 ERA in 74 2/3 innings (15% of all innings pitched by Toronto’s starters). However, the performance of the Big Three (Berrios, Gausman, and Bassitt) has negatively regressed after the 2022 campaign. The ERAs of the Big Three were 3.48, 3.85, and 3.98 in 2023, 2024, and 2025. On a relative basis, the difference between the American League Average Starter ERA and the Big Three’s ERA has steadily declined. The delta in 2023 was 0.86 (4.34 – 3.48), 0.21 (4.06 – 3.85) in 2024, and 0.06 (4.04 – 3.98) this campaign. Indeed, Eric Lauer’s 3.61 ERA has been a pleasant surprise. Yet, Scherzer’s 4.70 ERA and his late-career injury history, combined with the performance decline of the Big Three, cast doubts about the Toronto starting rotation’s ability to perform at an elite level in the postseason. During the playoffs, teams do not need a five-man rotation due to the number of off days. From 2014 to 2024, on average, three starters accounted for 83% of the starts of a World Series team. However, a fourth starting pitcher was needed to cover most of the remaining starts. Please note that I excluded 2020 because, due to the pandemic, the season and postseason were unusual. In constructing Table 2, I calculated the ERA, xERA, and FIP percentile rankings of MLB starters who pitched a minimum of 20 innings in 2025 (193 starters qualified). Because ERA, xERA, and FIP are all useful pitching metrics, I then calculated the average of these percentile rankings. For example, Lauer’s ERA, xERA, and FIP percentile rankings were 61, 86, and 67, respectively. Hence, the reader will observe that Lauer’s average of his ERA, xERA, and FIP percentile rankings is 72. Additionally, for each team’s rotation, I assumed that teams would use their best-performing starters (those with the highest average of their respective ERA, xERA, and FIP percentile rankings or those starters with the highest ERA percentile rankings) regardless. For example, Lauer will be part of the Top 4 and 3, but Scherzer will not. Please note that the percentiles and the related average were calculated to the fourth decimal place. Hence, the average presented may be one percentile point higher or lower due to rounding. Concerning starter slot numbers, I prefer to use the percentile rankings of a given metric. For example, a starting pitcher with an ERA that ranks in the 81st to 100th percentile is a#1 starter. A starter with an ERA that ranks in the 61st to 80th percentile is a #2. A #3 is a starter with an ERA in the 41st to 60th percentile. And on. I also applied this approach to evaluating a team’s Top 4, Top 3, and so on. Accordingly, Toronto’s Top 3’s average of the ERA, xERA, and FIP percentile rankings is at the lower range of a #2 starter. Now compare Toronto’s Top 3 to those of the Tigers, Astros, and Yankees. They have Top 3 starters in the lower end of the #1 starter slot. In other words, thus far in 2025, the Top 3 of those foes are decidedly better than Toronto’s. Furthermore, the Tigers, Astros, Yankees, and Red Sox have much superior #1 starters than Toronto. Additionally, based on ERA, Toronto’s starter groupings (Top 4, Top 3, etc.) fall well short of the other listed teams. Toronto would greatly benefit if it acquired a starter who can be a number one or number two. Let us begin the search! The criteria I used to select starter targets are as follows: Any team with a probability of making the postseason of 25% or less (as of July 20) is a seller. Please refer to FanGraphs for the list of teams. A starter must have a trade value (per Baseball Trade Values as of July 20) of less than $40 million. Starting pitchers must have a minimum of 300 career MLB innings pitched. I excluded any pitcher, currently on the 60-day Injured List, and not scheduled to return until after the July 31 trade deadline. The average of a starter's ERA, xERA, and FIP percentile rankings must be higher than 60. I use Baseball Trade Values as the source for player trade value because it is an objective third-party with a good, yet not perfect, track record. Ultimately, the market determines a player’s trade value, and various factors influence that value, including demand and supply, trade deadline pressure, and different approaches to valuing players. For an explanation of how BTV values players, please refer to this and this. Concerning the $40 million threshold, I selected that cut-off number because Toronto has a limited number of high-end trade chips. Hence, because Toronto’s three most valued prospects (per BTV) have a total value of $54.1 million, the Blue Jays are unlikely to have the player capital needed to acquire Paul Skenes ($132.9 million BTV) or Hunter Greene ($130.6 million BTV). Lo, and behold, Table 4, the list of trade targets! Please note that the “availability” assessment is according to BTV. Although the names in Table 4 are interesting, what matters is the impact an acquired starter would have on Toronto during the remainder of the 2025 season and the postseason. If only there were a table handy to see the impact of an acquired starter on the Blue Jays’ fortunes. Hmmm. Wouldn’t you know it, there is! See Table 5. Table 5 is Table 2’s data with the insertion of a selection of player metrics found in Table 4. The highlights from Table 5 are as follows: Based on 2025’s numbers, Trevor Rogers, Adrian Houser, or Kris Bubic would vault Toronto’s rotation into the upper echelon of the listed AL ballclubs. Sonny Gray or Merrill Kelly would improve the Blue Jays’ collection of starters but would not significantly move the needle. Many MLB observers have identified Mitch Keller as a trade target, but his 2025 performance is similar to that of Gray and Kelly. Like Keller, some people have opined that Seth Lugo should be a trade target for Toronto. Although his ERA is 85th percentile, his xERA and FIP marks are 36th and 49th percentile, respectively. I am not keen on Lugo. Starter Targets Rogers would be my #1 target. Admittedly, I am cheating because it is unlikely that Baltimore would make him available. However, it is hard to overlook the significant impact he would make on Toronto’s 2025 rotation, as shown in Table 5. Although his 2024 season was disappointing, it was likely due to his recovery from injuries. Furthermore, Rogers is under team control for the 2026 season, and his current salary is $2.6 million (2026 will be his final arb year). Although the acquisition cost is higher than Kelly’s and Houser’s, Rogers’s 2025 performance and 2026 contract status make him a worthwhile investment, justifying the higher acquisition cost. Kelly would be a solid #2 starter. He would be a high-quality addition that would bolster the overall performance of Toronto’s rotation. As Table 6 shows, his ERA- has been better than average in the past three seasons. Lastly, Kelly’s BTV is not onerous. On the negative side, Kelly would be a rental. As Table 5 shows, Houser’s average of his ERA, xERA, and FIP percentile rankings would noticeably improve the relative status of Toronto’s starting rotation. Additionally, his low BTV would give Toronto’s management more remaining assets to make other acquisitions than a Rogers trade would. My concern with Houser is whether he can maintain his current performance level. However, his FIP suggests that he can maintain his pitching prowess for the balance of the 2025 campaign. Lastly, like Kelly, Houser would be a rental. The Last Word Toronto’s starting rotation has underperformed this year. Although the depth starters have not pitched well, the Big Three have been around league average. Furthermore, given the need to use four starters in the postseason, Toronto’s Top 4 and Top 3, for that matter, lag the American League teams they may face in the postseason. Accordingly, if Toronto adds a high-quality starting pitcher for the balance of the 2025 season and the postseason, Blue Jays' management would enhance the odds of making the playoffs and succeeding in them. My preferred starter targets, from most desired to least, are Rogers, Kelly, and Houser. View full article
-
 As the MLB deadline approaches, many rumours are swirling around the Blue Jays. Media speculation includes Toronto’s interest in improving the bullpen, acquiring a right-handed power bat, and adding a pitcher to the starting rotation. The performance of the Blue Jays’ starting rotation has declined since 2023, when their starters produced a 3.85 ERA, followed by a 3.95 ERA in 2024 and a 4.55 ERA thus far in 2025. Among American League rotations, those ERA marks ranked second, ninth, and thirteenth, respectively. Part of that decline in 2025 is attributable to the underperformance of the starters not named José Berrios, Kevin Gausman, Chris Bassitt, Max Scherzer, and Bowden Francis. The other starters have produced a 5.79 ERA in 74 2/3 innings (15% of all innings pitched by Toronto’s starters). However, the performance of the Big Three (Berrios, Gausman, and Bassitt) has negatively regressed after the 2022 campaign. The ERAs of the Big Three were 3.48, 3.85, and 3.98 in 2023, 2024, and 2025. On a relative basis, the difference between the American League Average Starter ERA and the Big Three’s ERA has steadily declined. The delta in 2023 was 0.86 (4.34 – 3.48), 0.21 (4.06 – 3.85) in 2024, and 0.06 (4.04 – 3.98) this campaign. Indeed, Eric Lauer’s 3.61 ERA has been a pleasant surprise. Yet, Scherzer’s 4.70 ERA and his late-career injury history, combined with the performance decline of the Big Three, cast doubts about the Toronto starting rotation’s ability to perform at an elite level in the postseason. During the playoffs, teams do not need a five-man rotation due to the number of off days. From 2014 to 2024, on average, three starters accounted for 83% of the starts of a World Series team. However, a fourth starting pitcher was needed to cover most of the remaining starts. Please note that I excluded 2020 because, due to the pandemic, the season and postseason were unusual. In constructing Table 2, I calculated the ERA, xERA, and FIP percentile rankings of MLB starters who pitched a minimum of 20 innings in 2025 (193 starters qualified). Because ERA, xERA, and FIP are all useful pitching metrics, I then calculated the average of these percentile rankings. For example, Lauer’s ERA, xERA, and FIP percentile rankings were 61, 86, and 67, respectively. Hence, the reader will observe that Lauer’s average of his ERA, xERA, and FIP percentile rankings is 72. Additionally, for each team’s rotation, I assumed that teams would use their best-performing starters (those with the highest average of their respective ERA, xERA, and FIP percentile rankings or those starters with the highest ERA percentile rankings) regardless. For example, Lauer will be part of the Top 4 and 3, but Scherzer will not. Please note that the percentiles and the related average were calculated to the fourth decimal place. Hence, the average presented may be one percentile point higher or lower due to rounding. Concerning starter slot numbers, I prefer to use the percentile rankings of a given metric. For example, a starting pitcher with an ERA that ranks in the 81st to 100th percentile is a#1 starter. A starter with an ERA that ranks in the 61st to 80th percentile is a #2. A #3 is a starter with an ERA in the 41st to 60th percentile. And on. I also applied this approach to evaluating a team’s Top 4, Top 3, and so on. Accordingly, Toronto’s Top 3’s average of the ERA, xERA, and FIP percentile rankings is at the lower range of a #2 starter. Now compare Toronto’s Top 3 to those of the Tigers, Astros, and Yankees. They have Top 3 starters in the lower end of the #1 starter slot. In other words, thus far in 2025, the Top 3 of those foes are decidedly better than Toronto’s. Furthermore, the Tigers, Astros, Yankees, and Red Sox have much superior #1 starters than Toronto. Additionally, based on ERA, Toronto’s starter groupings (Top 4, Top 3, etc.) fall well short of the other listed teams. Toronto would greatly benefit if it acquired a starter who can be a number one or number two. Let us begin the search! The criteria I used to select starter targets are as follows: Any team with a probability of making the postseason of 25% or less (as of July 20) is a seller. Please refer to FanGraphs for the list of teams. A starter must have a trade value (per Baseball Trade Values as of July 20) of less than $40 million. Starting pitchers must have a minimum of 300 career MLB innings pitched. I excluded any pitcher, currently on the 60-day Injured List, and not scheduled to return until after the July 31 trade deadline. The average of a starter's ERA, xERA, and FIP percentile rankings must be higher than 60. I use Baseball Trade Values as the source for player trade value because it is an objective third-party with a good, yet not perfect, track record. Ultimately, the market determines a player’s trade value, and various factors influence that value, including demand and supply, trade deadline pressure, and different approaches to valuing players. For an explanation of how BTV values players, please refer to this and this. Concerning the $40 million threshold, I selected that cut-off number because Toronto has a limited number of high-end trade chips. Hence, because Toronto’s three most valued prospects (per BTV) have a total value of $54.1 million, the Blue Jays are unlikely to have the player capital needed to acquire Paul Skenes ($132.9 million BTV) or Hunter Greene ($130.6 million BTV). Lo, and behold, Table 4, the list of trade targets! Please note that the “availability” assessment is according to BTV. Although the names in Table 4 are interesting, what matters is the impact an acquired starter would have on Toronto during the remainder of the 2025 season and the postseason. If only there were a table handy to see the impact of an acquired starter on the Blue Jays’ fortunes. Hmmm. Wouldn’t you know it, there is! See Table 5. Table 5 is Table 2’s data with the insertion of a selection of player metrics found in Table 4. The highlights from Table 5 are as follows: Based on 2025’s numbers, Trevor Rogers, Adrian Houser, or Kris Bubic would vault Toronto’s rotation into the upper echelon of the listed AL ballclubs. Sonny Gray or Merrill Kelly would improve the Blue Jays’ collection of starters but would not significantly move the needle. Many MLB observers have identified Mitch Keller as a trade target, but his 2025 performance is similar to that of Gray and Kelly. Like Keller, some people have opined that Seth Lugo should be a trade target for Toronto. Although his ERA is 85th percentile, his xERA and FIP marks are 36th and 49th percentile, respectively. I am not keen on Lugo. Starter Targets Rogers would be my #1 target. Admittedly, I am cheating because it is unlikely that Baltimore would make him available. However, it is hard to overlook the significant impact he would make on Toronto’s 2025 rotation, as shown in Table 5. Although his 2024 season was disappointing, it was likely due to his recovery from injuries. Furthermore, Rogers is under team control for the 2026 season, and his current salary is $2.6 million (2026 will be his final arb year). Although the acquisition cost is higher than Kelly’s and Houser’s, Rogers’s 2025 performance and 2026 contract status make him a worthwhile investment, justifying the higher acquisition cost. Kelly would be a solid #2 starter. He would be a high-quality addition that would bolster the overall performance of Toronto’s rotation. As Table 6 shows, his ERA- has been better than average in the past three seasons. Lastly, Kelly’s BTV is not onerous. On the negative side, Kelly would be a rental. As Table 5 shows, Houser’s average of his ERA, xERA, and FIP percentile rankings would noticeably improve the relative status of Toronto’s starting rotation. Additionally, his low BTV would give Toronto’s management more remaining assets to make other acquisitions than a Rogers trade would. My concern with Houser is whether he can maintain his current performance level. However, his FIP suggests that he can maintain his pitching prowess for the balance of the 2025 campaign. Lastly, like Kelly, Houser would be a rental. The Last Word Toronto’s starting rotation has underperformed this year. Although the depth starters have not pitched well, the Big Three have been around league average. Furthermore, given the need to use four starters in the postseason, Toronto’s Top 4 and Top 3, for that matter, lag the American League teams they may face in the postseason. Accordingly, if Toronto adds a high-quality starting pitcher for the balance of the 2025 season and the postseason, Blue Jays' management would enhance the odds of making the playoffs and succeeding in them. My preferred starter targets, from most desired to least, are Rogers, Kelly, and Houser.
 -
My view is that what happens during the Atkins Regime is their responsibility. One should not pick and choose from things that went well or did not. Additionally, the Bichette pick was ultimately made, which is a positive organizational move. Despite differing views held by the superior, the person given the authority to make the decision (the Scouting Director) did so.
-
Have the Blue Jays Succeeded in the Draft Under Ross Atkins?
Bob Ritchie posted an article in MLB Draft
.jpg.cd81b977ee846331cf59c0f27a52b477.jpg) MLB held the 2025 Rule 4 draft, formerly known as the June amateur draft, on July 13 and 14. The Toronto Blue Jays selected JoJo Parker with the eighth overall pick and made 19 selections in total. For complete coverage of Toronto's draft, this website is the place to be. The reader can review a scouting report for each draftee, along with additional insights about the player. The 2025 draft was the 10th during the Ross Atkins regime. Concerning first picks, the Blue Jays' highest pick slot was fifth (Austin Martin in 2020) and their lowest was 23rd (Brandon Barriera in 2022). For the 2016-2024 period, the average slot number of Toronto’s first pick was 17. The consensus from various media outlets is that the Blue Jays under Atkins have not drafted well. Analysts have pointed to selections such as T.J. Zeuch and Martin as proof that Toronto has drafted poorly under Atkins. Let’s examine the reasonableness of the "Atkins has drafted poorly" opinion. The Coin Flip How to assess a draft record? Many people use hindsight to evaluate draft results and often express an opinion that resembles, “The decision to draft Player X was bad/poor/good/great.” In my opinion, hindsight should not be used to assess the quality of draft selections. The reason is that when a team makes a draft pick, the front office is knowingly using incomplete information. In other words, draft selections are made with substantial uncertainty. Accordingly, after the fact, it is valid to opine whether a draft pick worked out or not, but not whether it was good or bad. In a previous article, I used the coin flip example to illustrate my point. Suppose someone offers you a coin-flip opportunity. You can pick heads or tails, and you select heads. If the coin comes up heads, you win $5; if it comes up tails, you pay $2. Given that the odds are 50/50 that the coin flip will be heads, you calculate your expected value to be $1.50 (50% of $5 less 50% of $2). So then, you agree to the bet. The person who made the offer flips the coin, and it lands on tails. You lose $2. Did you make a good decision? Yes, because your expected value of the bet was +$1.50. Unfortunately, your decision did not work out. The same approach should be used to evaluate drafts. Therefore, I will proceed to assess whether Toronto's drafting under Atkins has been successful. In other words, whether Toronto's drafts have worked out. I will exclude the 2025 MLB Draft from the analysis. To evaluate how Toronto’s 2016-2024 draft record compares to that of other teams, I compiled a list of drafted and signed players. For each player, I took note of his career Baseball Reference WAR as of July 13, 2025 (the last game before the All-Star Game break). Furthermore, I ignored players with negative bWAR because I wanted to avoid distorting a team’s record. Concerning the bWAR approach, there are two limitations to consider: Similar to a rate-of-return calculation, bWAR results are end-date sensitive. For example, Team A’s bWAR may exceed Team B’s at the All-Star Game break, but it may not after the 2026 season. A reason why Team B’s bWAR total may ultimately surpass Team A’s bWAR is that some of Team B’s selections (from college or high school) are just making their way onto MLB rosters, whereas Team A's picks arrived on the MLB scene sooner. All things being equal, a college player, who may not ultimately generate as much bWAR as a high schooler, is more likely to be on an MLB roster sooner and begin accumulating bWAR. Hence, Team A’s draft record may temporarily be higher than Team B’s because Team A drafted more college players. However, despite these limitations, bWAR is a good, objective measure of a team’s drafting success. Onto Table 1! Table 1 highlights are as follows: Under Atkins, the Blue Jays have drafted and signed 16 players who have generated positive bWAR (for any team), which ranks 20th. Those players have produced a combined 46.7 bWAR, MLB’s 16th highest total. Concerning total bWAR, the top three teams are the Cardinals, Guardians and Dodgers. It is noteworthy that the average pick numbers of the first selections of the Cardinals, Guardians and Dodgers are 20, 17 and 27, respectively. Also, because of prospect promotion incentive picks and compensation picks, some teams will have additional selections that occur before the second round. Please refer to the 2024 draft order for an illustration. Some teams (for example, the Dodgers) will have their first-round pick dropped 10 spots because the team exceeded the competitive balance tax threshold. Please refer to the 2022 draft order for an explanation. After accounting for the additional picks and those falling into the second round, the Cardinals, Guardians and Dodgers had 11, 13 and 11 first-round picks, respectively. Toronto had 10. Another aspect of the Atkins regime’s draft record to explore is the players drafted under Atkins who have the highest and second-highest bWARs, and how they compare to the most productive draft picks by other teams. Consider Table 2 and Table 3. Table 2 shows that Bo Bichette (drafted in 2016) has produced the highest bWAR of any player drafted by Toronto from 2016 to 2024. That bWAR mark ranks as the sixth highest. As demonstrated in Table 3, Alek Manoah’s 7.3 bWAR ranks as the 18th highest among each team’s second-highest bWAR of drafted players. It is noteworthy that the Blue Jay names on Tables 2 and 3 were drafted before Shane Farrell became Toronto’s director of amateur scouting, a role he held from 2020 to 2024. Bichette was drafted when Brian Parker held Farrel’s position, and Toronto selected Manoah in the 2019 MLB Draft when Steve Sanders (2017-2019) was in the Director’s chair. Toronto’s current director of amateur scouting is Marc Tramuta. It will be interesting to see if the team's drafting will be more successful with Tramuta at the helm. Furthermore, as of July 13, 2025, the only Toronto draft pick taken after 2019 to generate a positive bWAR is Matt Swanson (0.3), currently with the Cardinals.. From a strictly bWAR perspective, Toronto’s post-2019 picks have generally not worked out. However, there is some good news that will soften the harshness of my previous comment. Arjun Nimmala (2023) and Trey Yesavage (2024) are Baseball America’s 42nd and 69th-ranked prospects, respectively. First-Round Picks Except for Manoah, Atkins's front office has not selected a player in the first round who has a positive career bWAR. If I were to use hindsight, I would judge Toronto’s record of first-round picks to be terrible. However, as I noted earlier, hindsight is not a suitable basis for evaluating decisions made with incomplete and imperfect information. Accordingly, let’s play the "what if?" game. To play this game, substitute the name of Baseball America’s best-available undrafted player (when it was Toronto’s turn to make a selection) for each of Toronto’s first-round picks. Lo and behold, Table 4. If the Blue Jays had used Baseball America’s list, the total bWAR generated by those draftees would be 1.9, more than the team's actual 4.4. By this method, Toronto’s notable misses were Manoah instead of Bryson Stott, and Jordan Groshans in place of Matthew Libatore. However, the total 1.9 bWAR delta is not significant. Therefore, based on the Baseball America best-available-draftee method, Toronto’s first-round picks (2016-2024) have not worked out, but the margin is slight. Conclusion Overall, the Atkins regime’s drafts have worked out, but have also failed to meet expectations. Why do I say this? Team president Mark Shapiro said in 2018, “… you need to have waves of talent coming, and you need to have dozens of prospects — not two, three, five prospects.” In my opinion, the Atkins regime has not fully delivered on Shapiro’s goal. Yes, Toronto’s draft picks have produced 46.7 bWAR, the 16th most in MLB. However, given the draft results of the Cardinals, Guardians and Dodgers, I expected draft results closer to the top five rather than a cromulent 16th. In fairness, due to COVID-19 and the resulting difficulties in evaluating prospects, the 2020 draft presented challenges to all teams, including the Blue Jays with the fifth overall pick. Additionally, in 2022 and 2023, Toronto’s first picks were high school players (Barriera and Nimmala), who typically take longer to reach MLB than college players do. However, all things considered, the Atkins regime’s draft record is disappointing because it has not surpassed the high bar established by Shapiro. The Last Word Concerning the evaluation of a team’s draft record, a hindsight-based opinion, whether the record is good or poor, is not reasonable. Why? Because there is uncertainty inherent in draft selections when a team makes each pick. The coin-flip example illustrates this point. Hence, a hindsight-based opinion on whether a draft record is good or bad is the result of a flawed evaluation method. A better approach is to assess whether the team’s drafting has been successful. The bWAR generated by the Blue Jays’ selections ranks in the middle of the pack, which is better than many may realize. Additionally, there have been recent positive developments (Nimmala, Yesavage, and the emergence of 2018’s Addison Barger). However, the team's publicly stated objective to acquire and develop 'waves of prospects' has not been fully realized. Therefore, in my opinion, the Atkins regime’s drafting has been moderately successful, which is below expectations.
MLB held the 2025 Rule 4 draft, formerly known as the June amateur draft, on July 13 and 14. The Toronto Blue Jays selected JoJo Parker with the eighth overall pick and made 19 selections in total. For complete coverage of Toronto's draft, this website is the place to be. The reader can review a scouting report for each draftee, along with additional insights about the player. The 2025 draft was the 10th during the Ross Atkins regime. Concerning first picks, the Blue Jays' highest pick slot was fifth (Austin Martin in 2020) and their lowest was 23rd (Brandon Barriera in 2022). For the 2016-2024 period, the average slot number of Toronto’s first pick was 17. The consensus from various media outlets is that the Blue Jays under Atkins have not drafted well. Analysts have pointed to selections such as T.J. Zeuch and Martin as proof that Toronto has drafted poorly under Atkins. Let’s examine the reasonableness of the "Atkins has drafted poorly" opinion. The Coin Flip How to assess a draft record? Many people use hindsight to evaluate draft results and often express an opinion that resembles, “The decision to draft Player X was bad/poor/good/great.” In my opinion, hindsight should not be used to assess the quality of draft selections. The reason is that when a team makes a draft pick, the front office is knowingly using incomplete information. In other words, draft selections are made with substantial uncertainty. Accordingly, after the fact, it is valid to opine whether a draft pick worked out or not, but not whether it was good or bad. In a previous article, I used the coin flip example to illustrate my point. Suppose someone offers you a coin-flip opportunity. You can pick heads or tails, and you select heads. If the coin comes up heads, you win $5; if it comes up tails, you pay $2. Given that the odds are 50/50 that the coin flip will be heads, you calculate your expected value to be $1.50 (50% of $5 less 50% of $2). So then, you agree to the bet. The person who made the offer flips the coin, and it lands on tails. You lose $2. Did you make a good decision? Yes, because your expected value of the bet was +$1.50. Unfortunately, your decision did not work out. The same approach should be used to evaluate drafts. Therefore, I will proceed to assess whether Toronto's drafting under Atkins has been successful. In other words, whether Toronto's drafts have worked out. I will exclude the 2025 MLB Draft from the analysis. To evaluate how Toronto’s 2016-2024 draft record compares to that of other teams, I compiled a list of drafted and signed players. For each player, I took note of his career Baseball Reference WAR as of July 13, 2025 (the last game before the All-Star Game break). Furthermore, I ignored players with negative bWAR because I wanted to avoid distorting a team’s record. Concerning the bWAR approach, there are two limitations to consider: Similar to a rate-of-return calculation, bWAR results are end-date sensitive. For example, Team A’s bWAR may exceed Team B’s at the All-Star Game break, but it may not after the 2026 season. A reason why Team B’s bWAR total may ultimately surpass Team A’s bWAR is that some of Team B’s selections (from college or high school) are just making their way onto MLB rosters, whereas Team A's picks arrived on the MLB scene sooner. All things being equal, a college player, who may not ultimately generate as much bWAR as a high schooler, is more likely to be on an MLB roster sooner and begin accumulating bWAR. Hence, Team A’s draft record may temporarily be higher than Team B’s because Team A drafted more college players. However, despite these limitations, bWAR is a good, objective measure of a team’s drafting success. Onto Table 1! Table 1 highlights are as follows: Under Atkins, the Blue Jays have drafted and signed 16 players who have generated positive bWAR (for any team), which ranks 20th. Those players have produced a combined 46.7 bWAR, MLB’s 16th highest total. Concerning total bWAR, the top three teams are the Cardinals, Guardians and Dodgers. It is noteworthy that the average pick numbers of the first selections of the Cardinals, Guardians and Dodgers are 20, 17 and 27, respectively. Also, because of prospect promotion incentive picks and compensation picks, some teams will have additional selections that occur before the second round. Please refer to the 2024 draft order for an illustration. Some teams (for example, the Dodgers) will have their first-round pick dropped 10 spots because the team exceeded the competitive balance tax threshold. Please refer to the 2022 draft order for an explanation. After accounting for the additional picks and those falling into the second round, the Cardinals, Guardians and Dodgers had 11, 13 and 11 first-round picks, respectively. Toronto had 10. Another aspect of the Atkins regime’s draft record to explore is the players drafted under Atkins who have the highest and second-highest bWARs, and how they compare to the most productive draft picks by other teams. Consider Table 2 and Table 3. Table 2 shows that Bo Bichette (drafted in 2016) has produced the highest bWAR of any player drafted by Toronto from 2016 to 2024. That bWAR mark ranks as the sixth highest. As demonstrated in Table 3, Alek Manoah’s 7.3 bWAR ranks as the 18th highest among each team’s second-highest bWAR of drafted players. It is noteworthy that the Blue Jay names on Tables 2 and 3 were drafted before Shane Farrell became Toronto’s director of amateur scouting, a role he held from 2020 to 2024. Bichette was drafted when Brian Parker held Farrel’s position, and Toronto selected Manoah in the 2019 MLB Draft when Steve Sanders (2017-2019) was in the Director’s chair. Toronto’s current director of amateur scouting is Marc Tramuta. It will be interesting to see if the team's drafting will be more successful with Tramuta at the helm. Furthermore, as of July 13, 2025, the only Toronto draft pick taken after 2019 to generate a positive bWAR is Matt Swanson (0.3), currently with the Cardinals.. From a strictly bWAR perspective, Toronto’s post-2019 picks have generally not worked out. However, there is some good news that will soften the harshness of my previous comment. Arjun Nimmala (2023) and Trey Yesavage (2024) are Baseball America’s 42nd and 69th-ranked prospects, respectively. First-Round Picks Except for Manoah, Atkins's front office has not selected a player in the first round who has a positive career bWAR. If I were to use hindsight, I would judge Toronto’s record of first-round picks to be terrible. However, as I noted earlier, hindsight is not a suitable basis for evaluating decisions made with incomplete and imperfect information. Accordingly, let’s play the "what if?" game. To play this game, substitute the name of Baseball America’s best-available undrafted player (when it was Toronto’s turn to make a selection) for each of Toronto’s first-round picks. Lo and behold, Table 4. If the Blue Jays had used Baseball America’s list, the total bWAR generated by those draftees would be 1.9, more than the team's actual 4.4. By this method, Toronto’s notable misses were Manoah instead of Bryson Stott, and Jordan Groshans in place of Matthew Libatore. However, the total 1.9 bWAR delta is not significant. Therefore, based on the Baseball America best-available-draftee method, Toronto’s first-round picks (2016-2024) have not worked out, but the margin is slight. Conclusion Overall, the Atkins regime’s drafts have worked out, but have also failed to meet expectations. Why do I say this? Team president Mark Shapiro said in 2018, “… you need to have waves of talent coming, and you need to have dozens of prospects — not two, three, five prospects.” In my opinion, the Atkins regime has not fully delivered on Shapiro’s goal. Yes, Toronto’s draft picks have produced 46.7 bWAR, the 16th most in MLB. However, given the draft results of the Cardinals, Guardians and Dodgers, I expected draft results closer to the top five rather than a cromulent 16th. In fairness, due to COVID-19 and the resulting difficulties in evaluating prospects, the 2020 draft presented challenges to all teams, including the Blue Jays with the fifth overall pick. Additionally, in 2022 and 2023, Toronto’s first picks were high school players (Barriera and Nimmala), who typically take longer to reach MLB than college players do. However, all things considered, the Atkins regime’s draft record is disappointing because it has not surpassed the high bar established by Shapiro. The Last Word Concerning the evaluation of a team’s draft record, a hindsight-based opinion, whether the record is good or poor, is not reasonable. Why? Because there is uncertainty inherent in draft selections when a team makes each pick. The coin-flip example illustrates this point. Hence, a hindsight-based opinion on whether a draft record is good or bad is the result of a flawed evaluation method. A better approach is to assess whether the team’s drafting has been successful. The bWAR generated by the Blue Jays’ selections ranks in the middle of the pack, which is better than many may realize. Additionally, there have been recent positive developments (Nimmala, Yesavage, and the emergence of 2018’s Addison Barger). However, the team's publicly stated objective to acquire and develop 'waves of prospects' has not been fully realized. Therefore, in my opinion, the Atkins regime’s drafting has been moderately successful, which is below expectations. -
MLB held the 2025 Rule 4 draft, formerly known as the June amateur draft, on July 13 and 14. The Toronto Blue Jays selected JoJo Parker with the eighth overall pick and made 19 selections in total. For complete coverage of Toronto's draft, this website is the place to be. The reader can review a scouting report for each draftee, along with additional insights about the player. The 2025 draft was the 10th during the Ross Atkins regime. Concerning first picks, the Blue Jays' highest pick slot was fifth (Austin Martin in 2020) and their lowest was 23rd (Brandon Barriera in 2022). For the 2016-2024 period, the average slot number of Toronto’s first pick was 17. The consensus from various media outlets is that the Blue Jays under Atkins have not drafted well. Analysts have pointed to selections such as T.J. Zeuch and Martin as proof that Toronto has drafted poorly under Atkins. Let’s examine the reasonableness of the "Atkins has drafted poorly" opinion. The Coin Flip How to assess a draft record? Many people use hindsight to evaluate draft results and often express an opinion that resembles, “The decision to draft Player X was bad/poor/good/great.” In my opinion, hindsight should not be used to assess the quality of draft selections. The reason is that when a team makes a draft pick, the front office is knowingly using incomplete information. In other words, draft selections are made with substantial uncertainty. Accordingly, after the fact, it is valid to opine whether a draft pick worked out or not, but not whether it was good or bad. In a previous article, I used the coin flip example to illustrate my point. Suppose someone offers you a coin-flip opportunity. You can pick heads or tails, and you select heads. If the coin comes up heads, you win $5; if it comes up tails, you pay $2. Given that the odds are 50/50 that the coin flip will be heads, you calculate your expected value to be $1.50 (50% of $5 less 50% of $2). So then, you agree to the bet. The person who made the offer flips the coin, and it lands on tails. You lose $2. Did you make a good decision? Yes, because your expected value of the bet was +$1.50. Unfortunately, your decision did not work out. The same approach should be used to evaluate drafts. Therefore, I will proceed to assess whether Toronto's drafting under Atkins has been successful. In other words, whether Toronto's drafts have worked out. I will exclude the 2025 MLB Draft from the analysis. To evaluate how Toronto’s 2016-2024 draft record compares to that of other teams, I compiled a list of drafted and signed players. For each player, I took note of his career Baseball Reference WAR as of July 13, 2025 (the last game before the All-Star Game break). Furthermore, I ignored players with negative bWAR because I wanted to avoid distorting a team’s record. Concerning the bWAR approach, there are two limitations to consider: Similar to a rate-of-return calculation, bWAR results are end-date sensitive. For example, Team A’s bWAR may exceed Team B’s at the All-Star Game break, but it may not after the 2026 season. A reason why Team B’s bWAR total may ultimately surpass Team A’s bWAR is that some of Team B’s selections (from college or high school) are just making their way onto MLB rosters, whereas Team A's picks arrived on the MLB scene sooner. All things being equal, a college player, who may not ultimately generate as much bWAR as a high schooler, is more likely to be on an MLB roster sooner and begin accumulating bWAR. Hence, Team A’s draft record may temporarily be higher than Team B’s because Team A drafted more college players. However, despite these limitations, bWAR is a good, objective measure of a team’s drafting success. Onto Table 1! Table 1 highlights are as follows: Under Atkins, the Blue Jays have drafted and signed 16 players who have generated positive bWAR (for any team), which ranks 20th. Those players have produced a combined 46.7 bWAR, MLB’s 16th highest total. Concerning total bWAR, the top three teams are the Cardinals, Guardians and Dodgers. It is noteworthy that the average pick numbers of the first selections of the Cardinals, Guardians and Dodgers are 20, 17 and 27, respectively. Also, because of prospect promotion incentive picks and compensation picks, some teams will have additional selections that occur before the second round. Please refer to the 2024 draft order for an illustration. Some teams (for example, the Dodgers) will have their first-round pick dropped 10 spots because the team exceeded the competitive balance tax threshold. Please refer to the 2022 draft order for an explanation. After accounting for the additional picks and those falling into the second round, the Cardinals, Guardians and Dodgers had 11, 13 and 11 first-round picks, respectively. Toronto had 10. Another aspect of the Atkins regime’s draft record to explore is the players drafted under Atkins who have the highest and second-highest bWARs, and how they compare to the most productive draft picks by other teams. Consider Table 2 and Table 3. Table 2 shows that Bo Bichette (drafted in 2016) has produced the highest bWAR of any player drafted by Toronto from 2016 to 2024. That bWAR mark ranks as the sixth highest. As demonstrated in Table 3, Alek Manoah’s 7.3 bWAR ranks as the 18th highest among each team’s second-highest bWAR of drafted players. It is noteworthy that the Blue Jay names on Tables 2 and 3 were drafted before Shane Farrell became Toronto’s director of amateur scouting, a role he held from 2020 to 2024. Bichette was drafted when Brian Parker held Farrel’s position, and Toronto selected Manoah in the 2019 MLB Draft when Steve Sanders (2017-2019) was in the Director’s chair. Toronto’s current director of amateur scouting is Marc Tramuta. It will be interesting to see if the team's drafting will be more successful with Tramuta at the helm. Furthermore, as of July 13, 2025, the only Toronto draft pick taken after 2019 to generate a positive bWAR is Matt Swanson (0.3), currently with the Cardinals.. From a strictly bWAR perspective, Toronto’s post-2019 picks have generally not worked out. However, there is some good news that will soften the harshness of my previous comment. Arjun Nimmala (2023) and Trey Yesavage (2024) are Baseball America’s 42nd and 69th-ranked prospects, respectively. First-Round Picks Except for Manoah, Atkins's front office has not selected a player in the first round who has a positive career bWAR. If I were to use hindsight, I would judge Toronto’s record of first-round picks to be terrible. However, as I noted earlier, hindsight is not a suitable basis for evaluating decisions made with incomplete and imperfect information. Accordingly, let’s play the "what if?" game. To play this game, substitute the name of Baseball America’s best-available undrafted player (when it was Toronto’s turn to make a selection) for each of Toronto’s first-round picks. Lo and behold, Table 4. If the Blue Jays had used Baseball America’s list, the total bWAR generated by those draftees would be 1.9, more than the team's actual 4.4. By this method, Toronto’s notable misses were Manoah instead of Bryson Stott, and Jordan Groshans in place of Matthew Libatore. However, the total 1.9 bWAR delta is not significant. Therefore, based on the Baseball America best-available-draftee method, Toronto’s first-round picks (2016-2024) have not worked out, but the margin is slight. Conclusion Overall, the Atkins regime’s drafts have worked out, but have also failed to meet expectations. Why do I say this? Team president Mark Shapiro said in 2018, “… you need to have waves of talent coming, and you need to have dozens of prospects — not two, three, five prospects.” In my opinion, the Atkins regime has not fully delivered on Shapiro’s goal. Yes, Toronto’s draft picks have produced 46.7 bWAR, the 16th most in MLB. However, given the draft results of the Cardinals, Guardians and Dodgers, I expected draft results closer to the top five rather than a cromulent 16th. In fairness, due to COVID-19 and the resulting difficulties in evaluating prospects, the 2020 draft presented challenges to all teams, including the Blue Jays with the fifth overall pick. Additionally, in 2022 and 2023, Toronto’s first picks were high school players (Barriera and Nimmala), who typically take longer to reach MLB than college players do. However, all things considered, the Atkins regime’s draft record is disappointing because it has not surpassed the high bar established by Shapiro. The Last Word Concerning the evaluation of a team’s draft record, a hindsight-based opinion, whether the record is good or poor, is not reasonable. Why? Because there is uncertainty inherent in draft selections when a team makes each pick. The coin-flip example illustrates this point. Hence, a hindsight-based opinion on whether a draft record is good or bad is the result of a flawed evaluation method. A better approach is to assess whether the team’s drafting has been successful. The bWAR generated by the Blue Jays’ selections ranks in the middle of the pack, which is better than many may realize. Additionally, there have been recent positive developments (Nimmala, Yesavage, and the emergence of 2018’s Addison Barger). However, the team's publicly stated objective to acquire and develop 'waves of prospects' has not been fully realized. Therefore, in my opinion, the Atkins regime’s drafting has been moderately successful, which is below expectations. View full article
-
.jpg.3f7fdc557f5daf83d3ee77ce83b90e91.jpg) On Friday, June 27, the Toronto Blue Jays played Game 81 of the 2025 Major League Baseball season. Therefore, it is time for the tried-and-true (tired-and-true?) midseason review. One of the aspects of the team that needed improvement in 2025 was hitting. Last season, Toronto batters produced a 100 wRC+, the American League’s ninth-best. They scored 671 runs (11th-most), and their home run total of 156 ranked 13th among their American League brethren. Those 2024 marks were lower than 2023’s 106 wRC+, 746 runs scored, and 188 home runs. I’ll spare the reader the gory details, but those 2023 numbers were lower than the 2022 marks. Hence, Toronto’s management focused on better performance in the batter’s box from the 2025 Blue Jays. To that end, Toronto added Anthony Santander in the offseason. Unfortunately, Santander’s contributions to the offence have been limited because of underperformance (64 wRC+) and injury woes (he hasn’t played since May 29). Also, injuries have limited Daulton Varsho’s playing time and bat. He underwent offseason shoulder surgery, which delayed his 2025 debut until April 29. Additionally, he suffered a hamstring injury and has not played since May 31. Yet, in 24 games, Varsho produced a 105 wRC+, eight home runs and a 0.337 ISO. Despite these setbacks, Toronto’s batters have performed well thus far this season. Consider Table 1. Batting Summary by Month The Blue Jays had a poor start to the season. In March/April, their wRC+, ISO, runs scored, and home runs ranked no higher than 11th among American League teams. When the calendar turned to May, the Blue Jays lineup became a hitting machine. They ranked no lower than third in the listed metrics. As of June 29, Toronto lagged behind most of the other American League teams in the power department (ISO and home runs) in June. However, compared to other teams, Blue Jay batters were getting on base and scoring runs at a high rate. For the season to date, Toronto hitters have performed well in some metrics (wRC+, OBP, and runs scored), but not in others (ISO and home runs). Batting Details There are many blue cells on Table 2, which is a good thing. The highlights are as follows: Blue Jay batters have performed well in RISP situations. However, there is a significant amount of randomness in RISP results, particularly during the in-season period. For support, please refer to Table 3, which I compiled a few years ago for a Jays From the Couch article (hat tip to Shaun Doyle, JFtC Founder and Analyst Herder). For example, the team with the highest RISP OPS in the first half of the 2022 season posted the 25th-best mark in the second half. Yet, the ballclub with a 0.783 RISP OPS (#5) generated a 0.790 RISP OPS (#6) in the second part of the 2022 season. Therefore, as many studies have demonstrated, RISP results contain a significant amount of randomness and are accordingly not predictive. In other words, a word of caution concerning any assumptions about how the Blue Jays will perform in the second half of the 2025 campaign with RISP. I consider it a positive that Toronto’s wRC+ is above average whether facing right-handers or left-handers. Toronto’s wRC+ from the first to third batting slots ranks ninth, which is disappointing. However, after May 31, Toronto’s 123 wRC+ from these slots ranks as the fifth-highest. The better performance is mainly attributable to Addison Barger’s June wRC+, which was better than Santander’s and Varsho's May wRC+ numbers. The home and away splits are striking. However, the difference is likely due to randomness. For example, Toronto’s 2024 home wRC+ was 102, while it was 99 on the road. For the balance of the 2025 season, the home and away splits should move closer. Concerning wRC+ by position, the excellence of Alejandro Kirk and Vladimir Guerrero Jr. accounts for Toronto’s high catcher and first base rankings. Andrés Giménez’s low wRC+ is the reason for the Blue Jays' low second base ranking. Regarding left field, Jonatan Clase’s and Alan Roden’s low wRC+ figures have been a drag on the overall left field batting results. Run Distribution Concerning the sources of runs, Table 4 shows Toronto’s numbers and rankings among American League teams. For the sake of saving space, I presented only American League East teams and the highest-scoring team (Detroit). The table highlights Toronto’s strong ranking in scoring runs from balls in play (#3) and its less impressive ranking in scoring runs from home runs (#11). The latter observation is consistent with Table 1’s below-average ISO and home run totals. Player Batting Splits Table 5 contains splits by pitcher handedness. The items of note are as follows: George Springer has performed well at the plate, whether facing righties or lefties. Ernie Clement has pronounced splits. His 63 wRC+ versus right-handed pitchers lags far behind his 231 wRC+ when facing southpaws. His 0.367 xwOBA against lefties suggests that the 0.498 wOBA is not sustainable. Furthermore, only 26% of all MLB plate appearances are against left-handers. Hence, we should not be surprised if Clement’s overall batting declines from these lofty heights. I would not be shocked if Giménez produces better batting box score results for the balance of 2025. With the caveat that MLB’s average xwOBA exceeds wOBA by 12 points, Giménez’s +30 point xwOBA-wOBA difference versus righties and +118 point xwOBA-wOBA delta against lefties suggests better “actual” batting results to come. Another aspect to examine is plate discipline. Hence, I present Table 6. Plate Discipline Concerning plate discipline, the highlights are as follows: On a relative basis, the Blue Jays chase pitches at a high rate. However, their Chase% in all counts, while the eighth-highest, is only one percentage point higher than the MLB Average. On the other hand, Toronto’s contact rate on pitches out of the strike zone is MLB’s best. With two strikes, be it on pitches in or out of the zone, Toronto’s high contact rate largely accounts for the team's MLB-lowest K% (17.7%). Additionally, as of June 30, the Blue Jays have the fewest plate appearances (1,545) and the lowest K% (36.6%) in two-strike counts. The Last Word Concerning batting performance, the Toronto Blue Jays exceeded expectations during the first half of the 2025 season. Despite injuries to key hitters (Santander and Varsho) and Santander’s underperformance, the team ranks in the top five in the AL in wRC+ and OBP. However, their power numbers trail those of most American League ballclubs. When I look at the balance of the 2025 season, I see encouraging signs. I expect Santander to return to form and Varsho to continue his above-average 2025 batting performance. Also, Toronto’s xwOBA exceeds its wOBA by 19 points. Hence, while there might be positive (Giménez) or negative (Clement) reversion at the player level, the xwOBA-wOBA delta does not indicate Lady Luck regression at the team level. Lastly, Ross Atkins stated that Toronto aims to acquire a right-handed bat, whether through internal or external means. Better Blue Jays' batting days are ahead!
On Friday, June 27, the Toronto Blue Jays played Game 81 of the 2025 Major League Baseball season. Therefore, it is time for the tried-and-true (tired-and-true?) midseason review. One of the aspects of the team that needed improvement in 2025 was hitting. Last season, Toronto batters produced a 100 wRC+, the American League’s ninth-best. They scored 671 runs (11th-most), and their home run total of 156 ranked 13th among their American League brethren. Those 2024 marks were lower than 2023’s 106 wRC+, 746 runs scored, and 188 home runs. I’ll spare the reader the gory details, but those 2023 numbers were lower than the 2022 marks. Hence, Toronto’s management focused on better performance in the batter’s box from the 2025 Blue Jays. To that end, Toronto added Anthony Santander in the offseason. Unfortunately, Santander’s contributions to the offence have been limited because of underperformance (64 wRC+) and injury woes (he hasn’t played since May 29). Also, injuries have limited Daulton Varsho’s playing time and bat. He underwent offseason shoulder surgery, which delayed his 2025 debut until April 29. Additionally, he suffered a hamstring injury and has not played since May 31. Yet, in 24 games, Varsho produced a 105 wRC+, eight home runs and a 0.337 ISO. Despite these setbacks, Toronto’s batters have performed well thus far this season. Consider Table 1. Batting Summary by Month The Blue Jays had a poor start to the season. In March/April, their wRC+, ISO, runs scored, and home runs ranked no higher than 11th among American League teams. When the calendar turned to May, the Blue Jays lineup became a hitting machine. They ranked no lower than third in the listed metrics. As of June 29, Toronto lagged behind most of the other American League teams in the power department (ISO and home runs) in June. However, compared to other teams, Blue Jay batters were getting on base and scoring runs at a high rate. For the season to date, Toronto hitters have performed well in some metrics (wRC+, OBP, and runs scored), but not in others (ISO and home runs). Batting Details There are many blue cells on Table 2, which is a good thing. The highlights are as follows: Blue Jay batters have performed well in RISP situations. However, there is a significant amount of randomness in RISP results, particularly during the in-season period. For support, please refer to Table 3, which I compiled a few years ago for a Jays From the Couch article (hat tip to Shaun Doyle, JFtC Founder and Analyst Herder). For example, the team with the highest RISP OPS in the first half of the 2022 season posted the 25th-best mark in the second half. Yet, the ballclub with a 0.783 RISP OPS (#5) generated a 0.790 RISP OPS (#6) in the second part of the 2022 season. Therefore, as many studies have demonstrated, RISP results contain a significant amount of randomness and are accordingly not predictive. In other words, a word of caution concerning any assumptions about how the Blue Jays will perform in the second half of the 2025 campaign with RISP. I consider it a positive that Toronto’s wRC+ is above average whether facing right-handers or left-handers. Toronto’s wRC+ from the first to third batting slots ranks ninth, which is disappointing. However, after May 31, Toronto’s 123 wRC+ from these slots ranks as the fifth-highest. The better performance is mainly attributable to Addison Barger’s June wRC+, which was better than Santander’s and Varsho's May wRC+ numbers. The home and away splits are striking. However, the difference is likely due to randomness. For example, Toronto’s 2024 home wRC+ was 102, while it was 99 on the road. For the balance of the 2025 season, the home and away splits should move closer. Concerning wRC+ by position, the excellence of Alejandro Kirk and Vladimir Guerrero Jr. accounts for Toronto’s high catcher and first base rankings. Andrés Giménez’s low wRC+ is the reason for the Blue Jays' low second base ranking. Regarding left field, Jonatan Clase’s and Alan Roden’s low wRC+ figures have been a drag on the overall left field batting results. Run Distribution Concerning the sources of runs, Table 4 shows Toronto’s numbers and rankings among American League teams. For the sake of saving space, I presented only American League East teams and the highest-scoring team (Detroit). The table highlights Toronto’s strong ranking in scoring runs from balls in play (#3) and its less impressive ranking in scoring runs from home runs (#11). The latter observation is consistent with Table 1’s below-average ISO and home run totals. Player Batting Splits Table 5 contains splits by pitcher handedness. The items of note are as follows: George Springer has performed well at the plate, whether facing righties or lefties. Ernie Clement has pronounced splits. His 63 wRC+ versus right-handed pitchers lags far behind his 231 wRC+ when facing southpaws. His 0.367 xwOBA against lefties suggests that the 0.498 wOBA is not sustainable. Furthermore, only 26% of all MLB plate appearances are against left-handers. Hence, we should not be surprised if Clement’s overall batting declines from these lofty heights. I would not be shocked if Giménez produces better batting box score results for the balance of 2025. With the caveat that MLB’s average xwOBA exceeds wOBA by 12 points, Giménez’s +30 point xwOBA-wOBA difference versus righties and +118 point xwOBA-wOBA delta against lefties suggests better “actual” batting results to come. Another aspect to examine is plate discipline. Hence, I present Table 6. Plate Discipline Concerning plate discipline, the highlights are as follows: On a relative basis, the Blue Jays chase pitches at a high rate. However, their Chase% in all counts, while the eighth-highest, is only one percentage point higher than the MLB Average. On the other hand, Toronto’s contact rate on pitches out of the strike zone is MLB’s best. With two strikes, be it on pitches in or out of the zone, Toronto’s high contact rate largely accounts for the team's MLB-lowest K% (17.7%). Additionally, as of June 30, the Blue Jays have the fewest plate appearances (1,545) and the lowest K% (36.6%) in two-strike counts. The Last Word Concerning batting performance, the Toronto Blue Jays exceeded expectations during the first half of the 2025 season. Despite injuries to key hitters (Santander and Varsho) and Santander’s underperformance, the team ranks in the top five in the AL in wRC+ and OBP. However, their power numbers trail those of most American League ballclubs. When I look at the balance of the 2025 season, I see encouraging signs. I expect Santander to return to form and Varsho to continue his above-average 2025 batting performance. Also, Toronto’s xwOBA exceeds its wOBA by 19 points. Hence, while there might be positive (Giménez) or negative (Clement) reversion at the player level, the xwOBA-wOBA delta does not indicate Lady Luck regression at the team level. Lastly, Ross Atkins stated that Toronto aims to acquire a right-handed bat, whether through internal or external means. Better Blue Jays' batting days are ahead! -
On Friday, June 27, the Toronto Blue Jays played Game 81 of the 2025 Major League Baseball season. Therefore, it is time for the tried-and-true (tired-and-true?) midseason review. One of the aspects of the team that needed improvement in 2025 was hitting. Last season, Toronto batters produced a 100 wRC+, the American League’s ninth-best. They scored 671 runs (11th-most), and their home run total of 156 ranked 13th among their American League brethren. Those 2024 marks were lower than 2023’s 106 wRC+, 746 runs scored, and 188 home runs. I’ll spare the reader the gory details, but those 2023 numbers were lower than the 2022 marks. Hence, Toronto’s management focused on better performance in the batter’s box from the 2025 Blue Jays. To that end, Toronto added Anthony Santander in the offseason. Unfortunately, Santander’s contributions to the offence have been limited because of underperformance (64 wRC+) and injury woes (he hasn’t played since May 29). Also, injuries have limited Daulton Varsho’s playing time and bat. He underwent offseason shoulder surgery, which delayed his 2025 debut until April 29. Additionally, he suffered a hamstring injury and has not played since May 31. Yet, in 24 games, Varsho produced a 105 wRC+, eight home runs and a 0.337 ISO. Despite these setbacks, Toronto’s batters have performed well thus far this season. Consider Table 1. Batting Summary by Month The Blue Jays had a poor start to the season. In March/April, their wRC+, ISO, runs scored, and home runs ranked no higher than 11th among American League teams. When the calendar turned to May, the Blue Jays lineup became a hitting machine. They ranked no lower than third in the listed metrics. As of June 29, Toronto lagged behind most of the other American League teams in the power department (ISO and home runs) in June. However, compared to other teams, Blue Jay batters were getting on base and scoring runs at a high rate. For the season to date, Toronto hitters have performed well in some metrics (wRC+, OBP, and runs scored), but not in others (ISO and home runs). Batting Details There are many blue cells on Table 2, which is a good thing. The highlights are as follows: Blue Jay batters have performed well in RISP situations. However, there is a significant amount of randomness in RISP results, particularly during the in-season period. For support, please refer to Table 3, which I compiled a few years ago for a Jays From the Couch article (hat tip to Shaun Doyle, JFtC Founder and Analyst Herder). For example, the team with the highest RISP OPS in the first half of the 2022 season posted the 25th-best mark in the second half. Yet, the ballclub with a 0.783 RISP OPS (#5) generated a 0.790 RISP OPS (#6) in the second part of the 2022 season. Therefore, as many studies have demonstrated, RISP results contain a significant amount of randomness and are accordingly not predictive. In other words, a word of caution concerning any assumptions about how the Blue Jays will perform in the second half of the 2025 campaign with RISP. I consider it a positive that Toronto’s wRC+ is above average whether facing right-handers or left-handers. Toronto’s wRC+ from the first to third batting slots ranks ninth, which is disappointing. However, after May 31, Toronto’s 123 wRC+ from these slots ranks as the fifth-highest. The better performance is mainly attributable to Addison Barger’s June wRC+, which was better than Santander’s and Varsho's May wRC+ numbers. The home and away splits are striking. However, the difference is likely due to randomness. For example, Toronto’s 2024 home wRC+ was 102, while it was 99 on the road. For the balance of the 2025 season, the home and away splits should move closer. Concerning wRC+ by position, the excellence of Alejandro Kirk and Vladimir Guerrero Jr. accounts for Toronto’s high catcher and first base rankings. Andrés Giménez’s low wRC+ is the reason for the Blue Jays' low second base ranking. Regarding left field, Jonatan Clase’s and Alan Roden’s low wRC+ figures have been a drag on the overall left field batting results. Run Distribution Concerning the sources of runs, Table 4 shows Toronto’s numbers and rankings among American League teams. For the sake of saving space, I presented only American League East teams and the highest-scoring team (Detroit). The table highlights Toronto’s strong ranking in scoring runs from balls in play (#3) and its less impressive ranking in scoring runs from home runs (#11). The latter observation is consistent with Table 1’s below-average ISO and home run totals. Player Batting Splits Table 5 contains splits by pitcher handedness. The items of note are as follows: George Springer has performed well at the plate, whether facing righties or lefties. Ernie Clement has pronounced splits. His 63 wRC+ versus right-handed pitchers lags far behind his 231 wRC+ when facing southpaws. His 0.367 xwOBA against lefties suggests that the 0.498 wOBA is not sustainable. Furthermore, only 26% of all MLB plate appearances are against left-handers. Hence, we should not be surprised if Clement’s overall batting declines from these lofty heights. I would not be shocked if Giménez produces better batting box score results for the balance of 2025. With the caveat that MLB’s average xwOBA exceeds wOBA by 12 points, Giménez’s +30 point xwOBA-wOBA difference versus righties and +118 point xwOBA-wOBA delta against lefties suggests better “actual” batting results to come. Another aspect to examine is plate discipline. Hence, I present Table 6. Plate Discipline Concerning plate discipline, the highlights are as follows: On a relative basis, the Blue Jays chase pitches at a high rate. However, their Chase% in all counts, while the eighth-highest, is only one percentage point higher than the MLB Average. On the other hand, Toronto’s contact rate on pitches out of the strike zone is MLB’s best. With two strikes, be it on pitches in or out of the zone, Toronto’s high contact rate largely accounts for the team's MLB-lowest K% (17.7%). Additionally, as of June 30, the Blue Jays have the fewest plate appearances (1,545) and the lowest K% (36.6%) in two-strike counts. The Last Word Concerning batting performance, the Toronto Blue Jays exceeded expectations during the first half of the 2025 season. Despite injuries to key hitters (Santander and Varsho) and Santander’s underperformance, the team ranks in the top five in the AL in wRC+ and OBP. However, their power numbers trail those of most American League ballclubs. When I look at the balance of the 2025 season, I see encouraging signs. I expect Santander to return to form and Varsho to continue his above-average 2025 batting performance. Also, Toronto’s xwOBA exceeds its wOBA by 19 points. Hence, while there might be positive (Giménez) or negative (Clement) reversion at the player level, the xwOBA-wOBA delta does not indicate Lady Luck regression at the team level. Lastly, Ross Atkins stated that Toronto aims to acquire a right-handed bat, whether through internal or external means. Better Blue Jays' batting days are ahead! View full article
-
- 1
-
.jpg.89cd7a04aed2db8fb9fe9e301f2ee3a8.jpg)
(1).jpg.d181ab8272189c1b51da1698db54f578.jpg)
.jpg.6bfed096e7424d57d251b037ae6e93db.jpg)
.jpg.cd81b977ee846331cf59c0f27a52b477.jpg)
.jpg.3f7fdc557f5daf83d3ee77ce83b90e91.jpg)