kcjaysfan
-
Posts
1,229 -
Joined
-
Last visited
Content Type
Profiles
Toronto Blue Jays Videos
2026 Toronto Blue Jays Top Prospects Ranking
Toronto Blue Jays Free Agent & Trade Rumors, Notes, & Tidbits
Guides & Resources
2025 Toronto Blue Jays Draft Pick Tracker
News
2026 Toronto Blue Jays Draft Pick Tracker
Forums
Blogs
Events
Store
Downloads
Gallery
Everything posted by kcjaysfan
-
 It's an internet meme.
 -
Uh oh, I detect a rustled jimmy or two.
-
Those were good times.
-
http://3.bp.blogspot.com/-rGUTjLHbWmk/T38D30ckdsI/AAAAAAAAB8M/pH0clAkhFnw/s1600/rustled-jimmies-1.jpg
-
I will take a giant s*** on you.
-
Don't lump science in with those fairy tales, you dirty prole.
-
I thought about that, but arbitrarily decided to only go with players who were either in the majors or AAA/Japan in 2013.
-
The all-Jose team. All the players were either in the majors in 2013, or in AAA/Japan. C -- Jose Molina (TBR) 1B -- Jose Gil (NYY, AAA) 2B -- Jose Altuve (HOU) 3B -- Jose Iglesias (DET) SS -- Jose Reyes (TOR) LF -- Jose Tabata (PIT) CF -- Jose Costanza (ATL) RF -- Jose Bautista (TOR) DH -- Jose Lopez (JPN) C -- Jose Lobaton (TBR) 2B/SS/3B -- Jose Ramirez (CLE) 2B/SS -- Jose Martinez (HOU, AAA) UTIL -- Jose Pirela (NYY, AAA) SP -- Jose Fernandez (MIA) SP -- Jose Quintana (CHW) SP -- Jose Cisnero (HOU) SP -- Jose Alvarez (DET) SP -- Jose Ramirez (NYY, AAA) CL -- Jose Veras (DET) RP -- Jose Valverde (DET) RP -- Jose Dominguez (LAD) RP -- Jose De La Torre (BOS) RP -- Jose Mijares (SFG) RP -- Jose Ortega (DET) RP -- Jose Diaz (CIN, AAA)
-
Jays targetting Jeff Samardzija and/or Ryan Hanigan
kcjaysfan replied to JugglingPitches's topic in Toronto Blue Jays Talk
While not necessarily syntactically pleasing, I would posit that King's use of the double negative was actually quite appropriate, as he was conveying that Happ did bring something to the team, with an emphasis on him disagreeing with MohYou. -
AA wants to corner the market on players named Jose. It's the new market inefficiency.
-
Blue Jays are "circling" Ricky Nolasco.
kcjaysfan replied to JaysFan4Ever's topic in Toronto Blue Jays Talk
Yeah, his name is so much easier to spell. That's the clincher! -
Jose Molina has 2-year agreement with Rays.
kcjaysfan replied to Angrioter's topic in Toronto Blue Jays Talk
What would you do with Thole and his $1.25M for next year? -
Jose Molina has 2-year agreement with Rays.
kcjaysfan replied to Angrioter's topic in Toronto Blue Jays Talk
Hanigan, or bust? -
Jays targetting Jeff Samardzija and/or Ryan Hanigan
kcjaysfan replied to JugglingPitches's topic in Toronto Blue Jays Talk
Samardzija's HR/9 was 0.01 higher than Quintana this season, and both his FIP and xFIP were lower. -
Let 'er Ride for 2014: My thoughts
kcjaysfan replied to BlueJaysGirl's topic in Toronto Blue Jays Talk
http://blog.3dcart.com/wp-content/uploads/2012/05/yay.jpg -
Let 'er Ride for 2014: My thoughts
kcjaysfan replied to BlueJaysGirl's topic in Toronto Blue Jays Talk
I should be working on a paper right now, but I'm lacking motivation, so I'm procrastinating. And I enjoy making tables. -
Let 'er Ride for 2014: My thoughts
kcjaysfan replied to BlueJaysGirl's topic in Toronto Blue Jays Talk
From his first game in May to the end of the season: [table=width: 500, class: outer_border] [tr] [td]Year[/td] [td]PA[/td] [td]2B[/td] [td]3B[/td] [td]HR[/td] [td]BB[/td] [td]K[/td] [td]BA[/td] [td]OBP[/td] [td]SLG[/td] [/tr] [tr] [td]2011[/td] [td]415[/td] [td]18[/td] [td]2[/td] [td]19[/td] [td]30[/td] [td]115[/td] [td].212[/td] [td].275[/td] [td].421[/td] [/tr] [tr] [td]2012[/td] [td]302[/td] [td]13[/td] [td]0[/td] [td]17[/td] [td]16[/td] [td]89[/td] [td].244[/td] [td].285[/td] [td].470[/td] [/tr] [tr] [td]2013[/td] [td]396[/td] [td]11[/td] [td]0[/td] [td]13[/td] [td]16[/td] [td]111[/td] [td].179[/td] [td].217[/td] [td].312[/td] [/tr] [/table] -
Let 'er Ride for 2014: My thoughts
kcjaysfan replied to BlueJaysGirl's topic in Toronto Blue Jays Talk
Getting value for Arencibia at the trade deadline next year is predicated upon him having sustained, significant success through July next year. While it is possible for him to regress closer to 2011/2012 JPA, he's just way too streaky to assume that he'll be of any worth on a month-to-month basis. Here's my highly-trained evaluation of his April-July stats from 2011-2013: [table=width: 500", class: outer_border] [tr] [td]Year[/td] [td]April/March[/td] [td]May[/td] [td]June[/td] [td]July[/td] [/tr] [tr] [td]2011[/td] [td]Good[/td] [td]Good[/td] [td]s***[/td] [td]Mediocre[/td] [/tr] [tr] [td]2012[/td] [td]s***[/td] [td]Good[/td] [td]s***[/td] [td]Very good[/td] [/tr] [tr] [td]2013[/td] [td]Good[/td] [td]s***[/td] [td]s***[/td] [td]s***[/td] [/tr] [/table] You also have to hope that someone needs a mediocre catcher at the deadline next year. -
Sporting News AL manager of the year is...
kcjaysfan replied to G-Snarls's topic in Toronto Blue Jays Talk
The Expos won 83 games in 2002 and 2003. Frank Robinson spent most of his time on the bench sleeping. -
He doesn't want to make an actual prediction, so he's equivocating.
-
Starting pitching wins championships
kcjaysfan replied to G-Snarls's topic in Toronto Blue Jays Talk
They seemed to do a pretty decent job of that this season. -
Ok, so let's say, hypothetically, he comes back next year, and puts up numbers similar to 2011. Do you then change your mind, and believe he wasn't taking PEDs in 2011, or do you assume he's gotten back on them? Since he failed the test last year while playing for the Giants, it would suggest a number of possibilities: He was actually clean while in 2011, and decided he wanted that little extra and started taking something in 2012. He was taking a different substance in 2011 that wasn't detected, and changed to something new in 2012 and was caught. He was taking the same thing in 2011 as he was in 2012, but just lucked out and wasn't caught. Without knowing the MLB's testing schedule and how long the tracers for detectable substances last in the body, it's impossible for us to know whether any player is taking PEDs.
-
So are you suggesting that he was using PEDs while he was on the Royals? I'm not saying that he wasn't, but he played a full season there and didn't fail any drug tests
-
More like Georgia agreeing with the eastern half of Missouri.
-
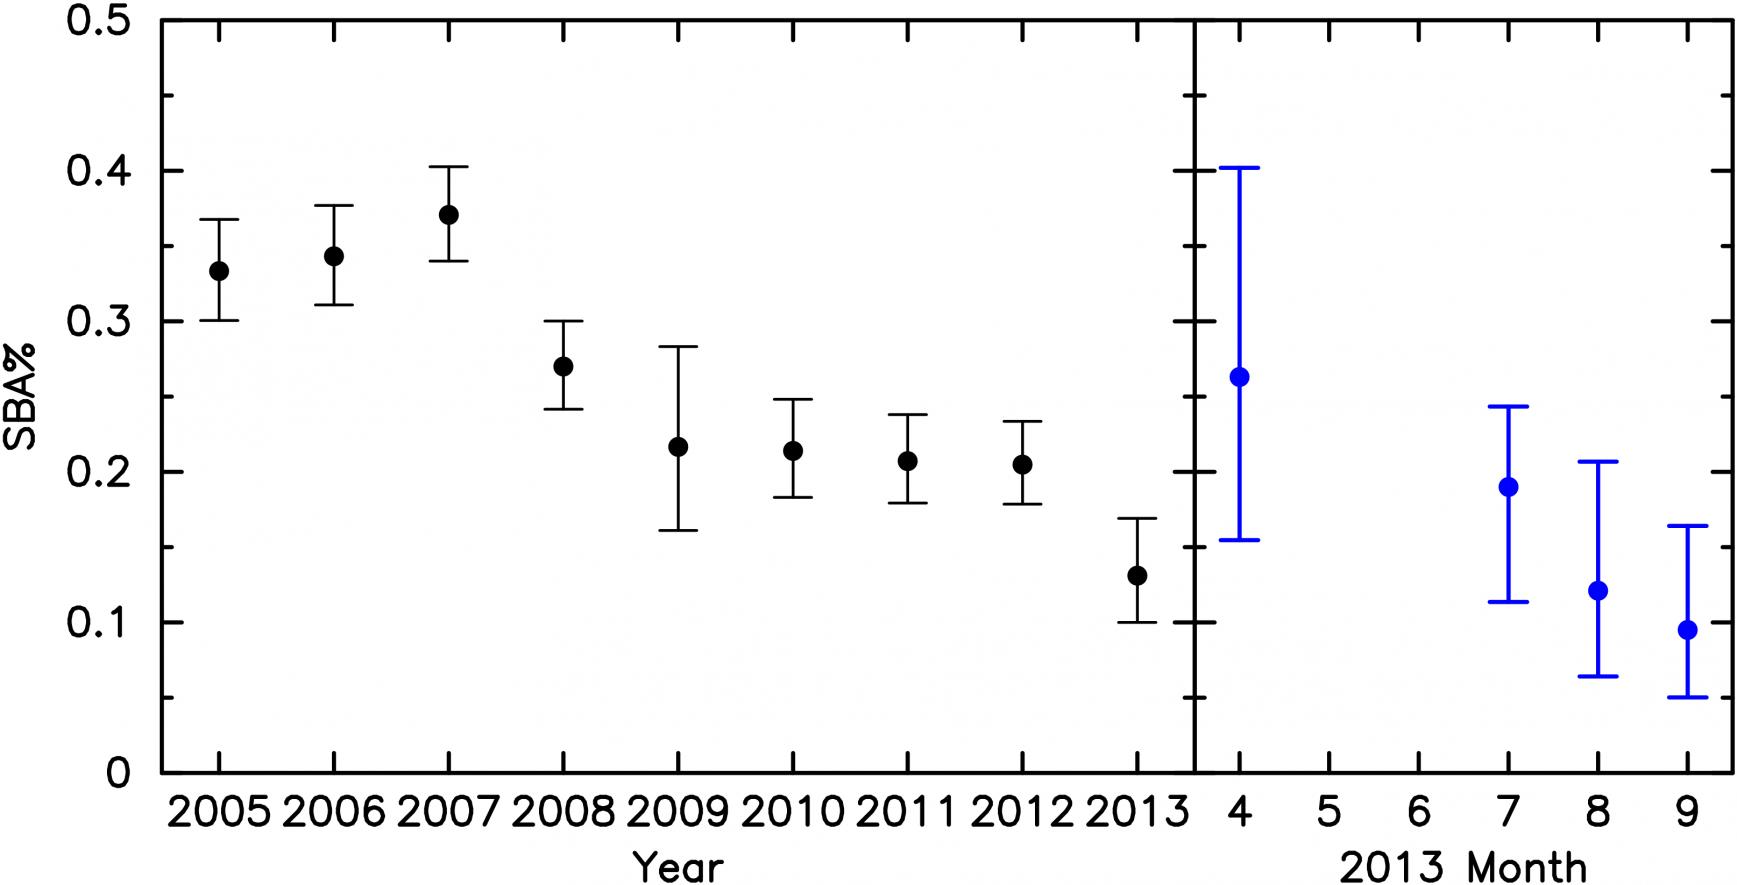
I was actually curious about how less frequently Reyes attempted steals after coming back from his injury. I don't necessarily buy this argument of "losing a step" but I thought it would be interesting to see how much he was possibly taking it easy on his leg. I decided to look at the rate at which he attempted steals. To do this properly, I would have to not only count the number of times a player gets on base, but also how many times he advanced a base (e.g., he would have two opportunities if he singled, then the next batter walked), and I would also have to consider the situation. Since I don't want to go through the box score of every game he's played (I'm bored, but not that bored), I'm just going to do this the dumb way, and count up the number of times he reached base, not including home runs and call that the chances. Then I'll add up stolen bases and caught stealing, which will give me the attempts. By dividing the attempts by the chances, we get an attempt rate. So, SBA% = (SB + CS) / (H + BB + HBP + ROE - HR) The left panel is his SBA% since 2005. His 2013 numbers only include his 83 games after he returned (there's only a 0.02 change). The right panel is the month-by-month breakdown of 2013. Since he only played five games in June, I lumped that in with July. While the (binomial) errors are pretty large, you can see that in the ~30 games right after coming back, he was back to roughly the SBA% as he had for 2010 through 2012. The next two months, he attempted fewer and fewer SBs, which I'd attribute to him taking it easy, especially since the team was utterly and completely out of contention. Granted, you could just as easily draw a straight horizontal line through the last three points and say that, within the noise, it's likely his attempt rate was pretty constant.