Frag
-
Posts
3,614 -
Joined
-
Last visited
Content Type
Profiles
Toronto Blue Jays Videos
2026 Toronto Blue Jays Top Prospects Ranking
Toronto Blue Jays Free Agent & Trade Rumors, Notes, & Tidbits
Guides & Resources
2025 Toronto Blue Jays Draft Pick Tracker
News
2026 Toronto Blue Jays Draft Pick Tracker
Forums
Blogs
Events
Store
Downloads
Gallery
Everything posted by Frag
-
Wow, bzapple and the Dude are far more infrequent than Nox.
-
Very interesting article.
-
I guess I'm not making the cut. /sadface
-
Breaking Blue: Toronto Blue Jays Blog is live
Frag replied to admin's topic in Toronto Blue Jays Talk
Fangraphs new cool feature that allows you to run a correlation among all pitching stats, including TIPS! -
Lol flames: And just a reminder to who Dave Poulin is, it's the same guy who called Lebda a "viable NHLer".
-
How is this not Boxy?
-
Now that's being optimistic!
-
Best poster: JFaS Funniest poster: Angrioter Best troll: Don't know, don't care Best thread: King Kalfus Beat new poster: King Comeback poster of year: Um... Best infrequent poster: Nox Best numbers poster: JFaS Worst troll: CHP Most annoying/ stupid poster: Don't know, don't care Biggest disappointment (decent poster that slipped): I dunno lol
-
0.67%
-
Hi everybody!
-
Leafs are getting SPANKED! Though, still not as bad as the 0-shot 3rd and OT periods... close, though
-
I love how even in this pic, Nonis seems to doubt his own words:

-
Next stop: Hall of Fame!
-
Breaking Blue: Toronto Blue Jays Blog is live
Frag replied to admin's topic in Toronto Blue Jays Talk
That's true. Could explain why you don't see much with pitchers. -
Breaking Blue: Toronto Blue Jays Blog is live
Frag replied to admin's topic in Toronto Blue Jays Talk
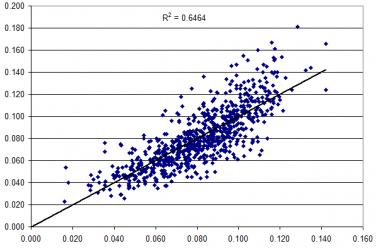
So I was curious to see what would happen if I would apply the same regression model Chris used for xK% (same independent variables), but for batters instead. Interesting to notice the strong relationship between xK% and K% (p < 0.0001): I did the same for xBB%. While the relationship between xBB% and BB% wasn't as strong, it was still pretty strong and statistically significant (p < 0.0001): There was also more noticeable heteroskedasticity in this model (the non-linear R^2 value was around 0.67), which I should probably check using a Levene's test. Otherwise, it looks good! In addition, just for interest's sake, I ran the same multiple regression model but with HR/FB ratio as the dependent variable. I got an adjusted R^2 value of 0.37 (p < 0.0001). Much lower than the other two, but still surprisingly significant. What do you think, Chris? I should state what data I used. I used players data btwn 2008-2013 seasons, minimum 200 PA (that's combined seasons, not single seasons, data). EDIT: Okay, so after running a Levene's test on the xBB%-BB% relationship, the p-value was less than 0.05. As such, the model violates the equality of variance requirement for regression. I'm guessing this is the result of a larger sample size needed for BB% relative to K%.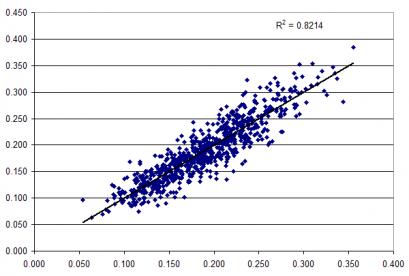
-
Quite.
-
McKenzie, Duthie and Dreger re-sign with TSN. Rogers vied hard to get them.
-
Also, Tyler Bozak placed on IR
-
I've been looking back at the 2003 draft (and I'll be looking at others later) to examine scouting reports of ALL prospects in the first 2 rounds at that time. Two things I noticed: 1) Not so surprising, many European prospects were seen as lacking character, while many North American prospects were seen as team leaders. 2) Some players scouts missed BADLY in judging the size of prospects at the time of the draft. I think many got caught up with height or weight, but had trouble combining the two in a reasonable manner. Surprising, considering BMI exists. Two extreme examples of these errors were Dustin Brown and Hugh Jessiman. The average BMI (calculated using height and weight measurements measured at the time) in the first round was 25.6. Dustin Brown, whom scouts were concerned about how his size may increase his chance of injury as a result of his aggressive playing style, had a BMI at the time of... 26.4! Now, on the other side of the table, we've got Hugh Jessiman, who was praised by scouts for his size. His BMI came in at... 24.3!
-
A's acquire Jim Johnson for 2B Jemile Weeks.
Frag replied to Angrioter's topic in Toronto Blue Jays Talk
Yet, the Orioles probably got more for Johnson than the Tigers got for Fister. -
Talk about a Domb move by Dumbrowski... wait...
-
Breaking Blue: Toronto Blue Jays Blog is live
Frag replied to admin's topic in Toronto Blue Jays Talk
This site helps re familiarizing yourself with R. I use it all the time when using R. -
McLaren a healthy scratch tonight. I... what? A... logical move by Carlyle!?
-
Fraser, especially with knee braces, sucks, but saying Rielly/Gardiner are two solid possession players while Ranger isn't is technically wrong.
-